
Brand
Summary
I was an individual contributor and responsible for the design efforts at the EDS team at Chennai. The management believed in seamless access to information for the employees at any point in time. Naturally, one of the solutions was to invest and build PayPal’s iOS app store, which hosts 50+ apps. During my tenure at PayPal, I designed and shipped two major iOS apps and updated three complex large scale existing web applications.
Responsibilities
UX Designer
Duration
2017 - 2018
Around 2017, the C-level executives laid out a well thought out roadmap ahead - Vision 2020. This vision empowered the various internal organizations to be autonomous but transparent in its governance. This opened up tremendous opportunities to restructure the way “Delivery groups” operate.
If data is considered as the new oil, then Enterprise Data Service (EDS) is the oil refinery of PayPal. EDS collects, monitors, manages, collaborates, and visualizes data from First party and third party tracking systems.
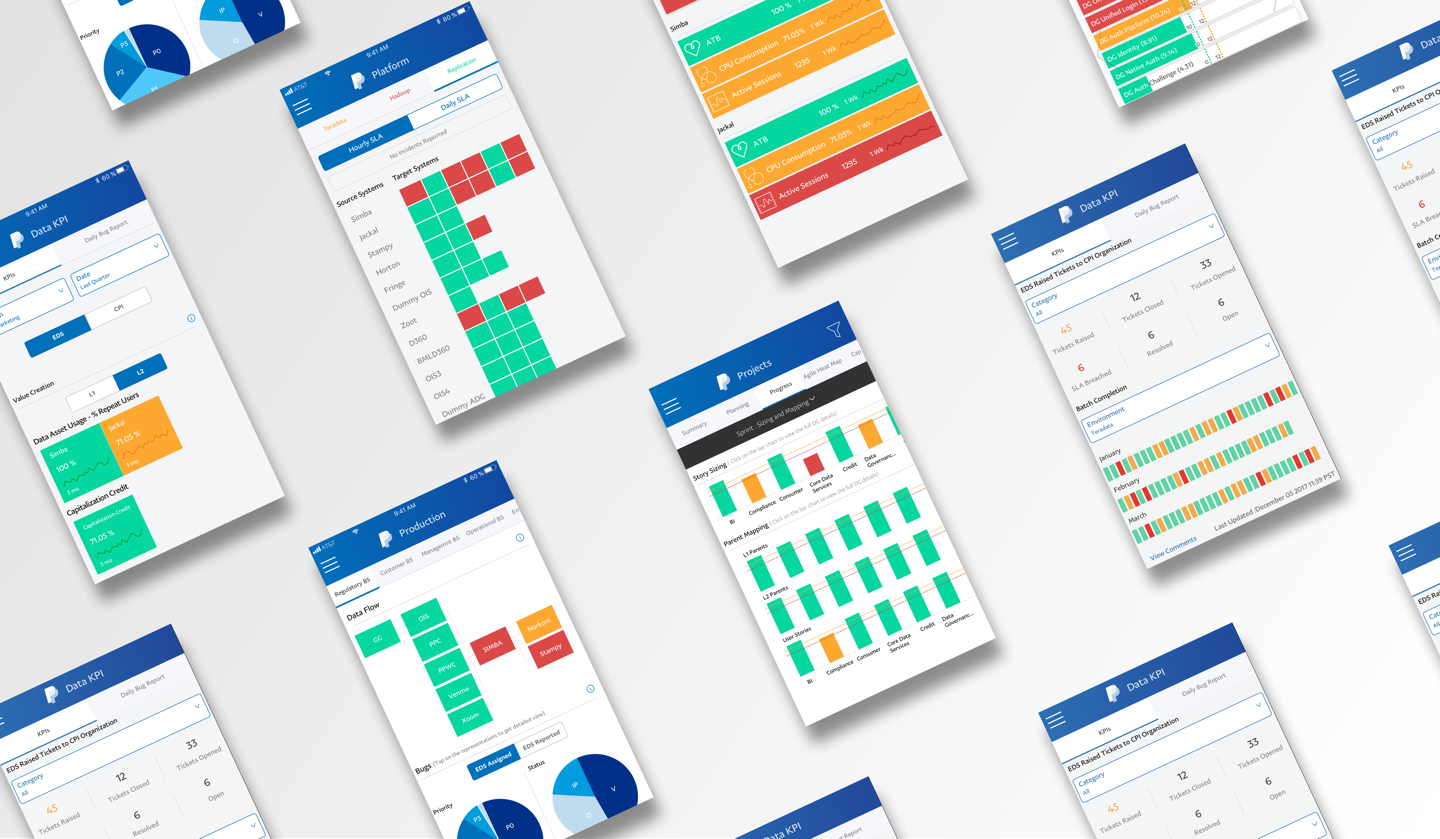
A very quick gif of some of the visualizations I designed for EDS
Laying the groundwork for the project
Being the only designer surrounded by developers, data analysts and Product owners has its own set of challenges. Because of the organizational restructuring, few teams gained access to data, few lost ownership of databases, and roles and responsibilities shifted. Asking the right questions to the right people was a nightmare. One of my mentors who is a Senior Project Manager shielded me from all uncertainty and provided me access to the information I needed, validated assumptions, and introduced me to right-ish people.
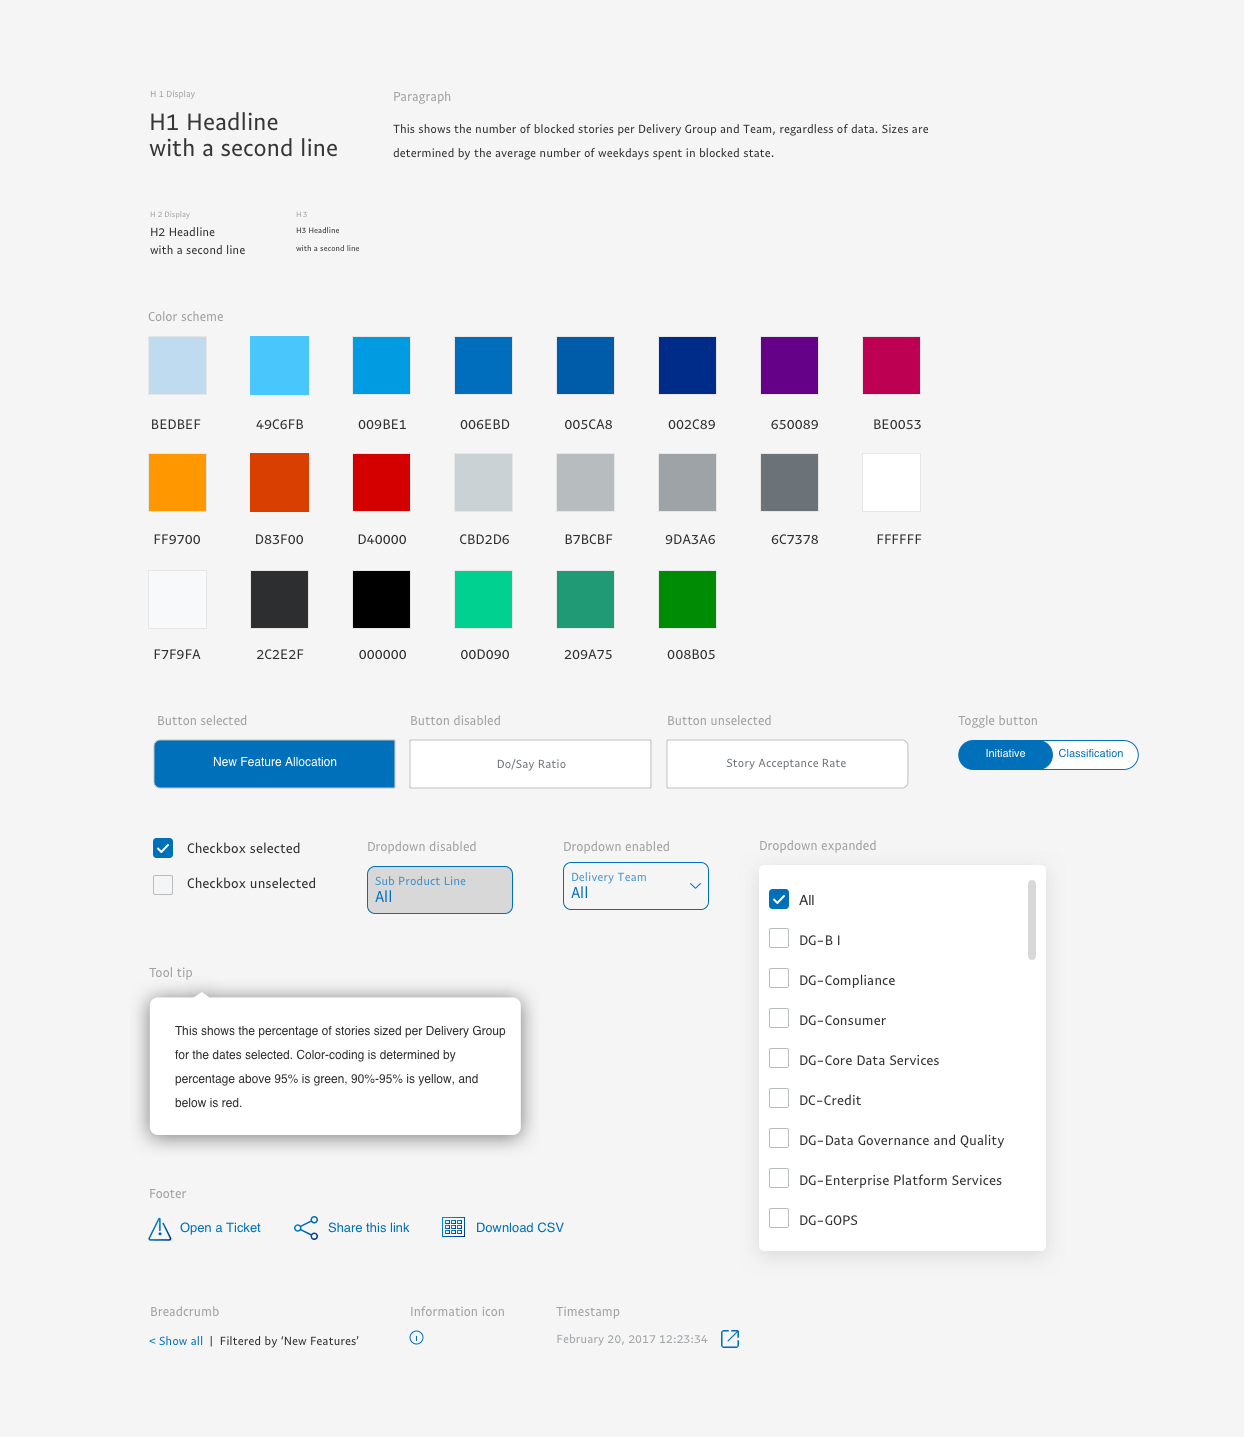
First things first - Bringing consistency
Due to this organizational restructuring, new teams were created, some were merged and some saw the sunset too. This means I have to make sure all the apps are visually consistent. PayPal has a style guide that is strictly enforced for consumer-facing products but enterprise applications did not follow this suit. I invested the first few weeks working creating a style guide borrowing specs from the PayPal style guide and built some components for data visualization. I teamed up with the engineering team to work on the Javascript part and shared the library
Approach a.k.a "The Process"
On a very high level, the design process at EDS consists of 5 steps. It is a very fluid process depending on the project and the requirements. For these projects, I skipped a few steps, but it gets the work done, and the target audience was happy - a win-win situation.

At PayPal, Whiteboarding is considered as wireframes. Once the concepts are agreed upon, I skip the low-fidelity part and directly use the components from the design system I contributed to. This helped us to create MVP in very short timeframes.
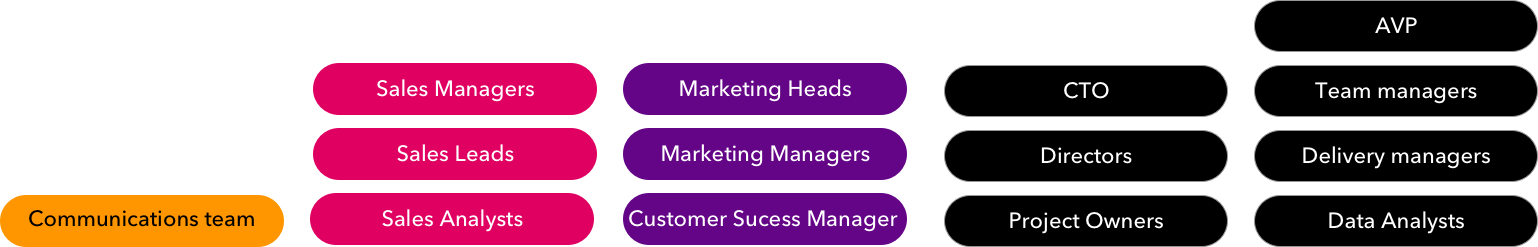
More and more users to consider while designing
The initial scope of the project was to cater to the needs of the various delivery teams inside the delivery group, EDS. There were 100 users. As newer teams took more responsibilities, they wanted more data to make informed decisions. More requests for data and visualizations started pouring in. Finally, the user groups became very diverse. This includes everyone from the CTO to every data analyst across the EDS, marketing, customer success, and the PR team.
Designing for data visualization
The majority of my work revolved around designing around data for mobile real estate that help users make informed decisions. One challenge that I faced was the existing visualizations were not mobile-friendly.
Job To Be Done (JTBD) approach
Job to be done is best suited for user flows where users perform a series of steps to complete a task. With a good user experience, a user can complete the task faster.
Questions To Be Answered (QTBA) approach
Answering a question means exploring various visualizations by filtering and sorting. Hence, finding an insight cannot take the same approach as a user task. Exploring insights and data is not linear and does not have a clear goal. In addition to that, most dashboards use dynamic datasets, hence most tasks a user does is exploratory.
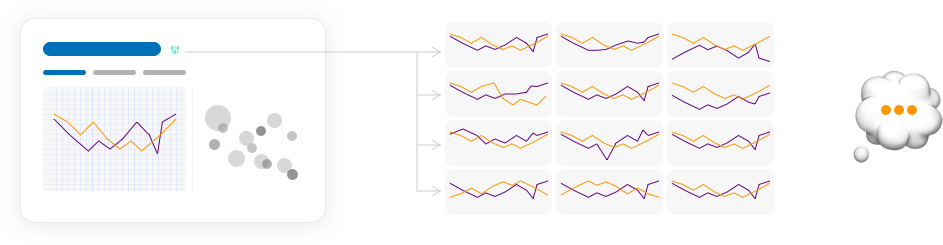
Different users want various types of visualization and granularity of the same data.
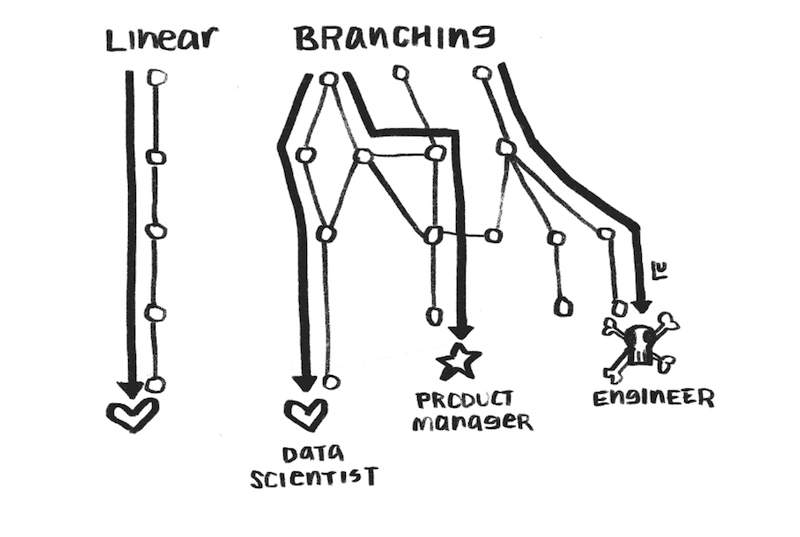
Credits to Susie Lu
Understanding how users percieve data
Resizing visualizations to fit the mobile real estate does not provide a functional experience. I asked a lot of "how may I" questions to come up with different visualizations using convergence and divergence methods and A/B tested them to validate them right away.
My designs were informed by the following directions.
- How do the users perceive data?
- What level of granularity do users want to see in their data upfront?
- Do users want to see the same visualization in mobile too?
- How long do users spend exploring various visualizations?
Show and tell approach
I used the “Show and tell” technique, which is unconventional, to understand how users perceive a visualization. This was an essential step because most of the visualizations in the desktop application can not be reused for mobile responsiveness.
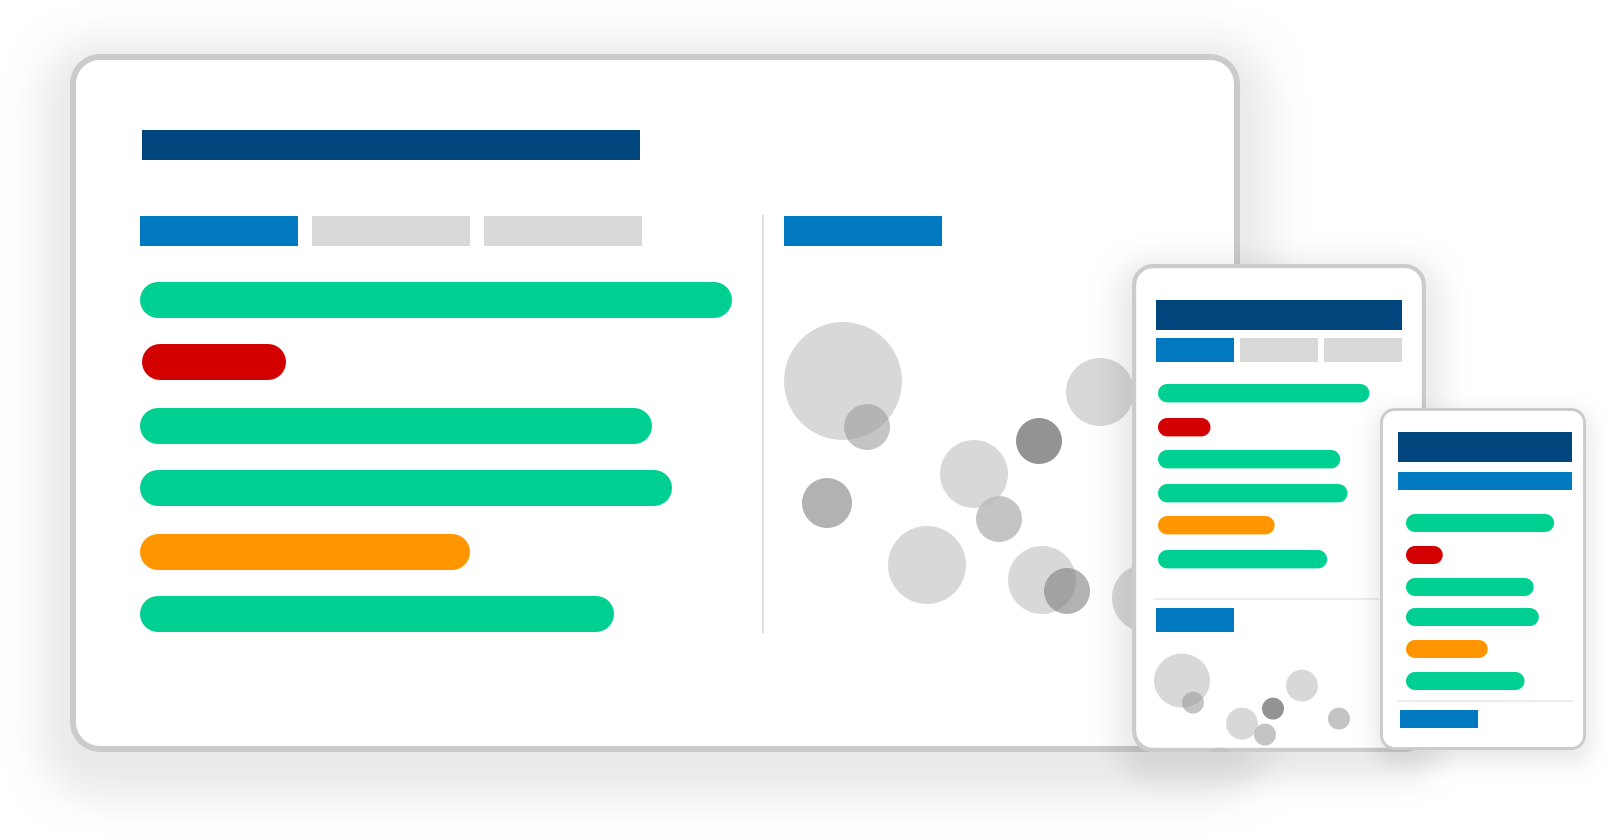
Colors make user's life easier

Color-coded visualization keeps the organization running smoothly. It helps users to spot any incidents or issues.
- Visualizations in Green is an indication that everything is smooth.
- Visualizations in amber draw the user’s attention and are monitored closely.
- Visualizations in red draw the user’s full attention.
Consistent visualization is preferred
"Familiarity bread contempt" is not valid for data-centric dashboards. Breaking the mental model of how users perceive the data is something that I wanted to avoid as much as possible.
Design Philosophy for data visulaization
I took inspiration from Dr. Ben Shniderman’s information visualization mantra to design effective data-centric visualization dashboards.

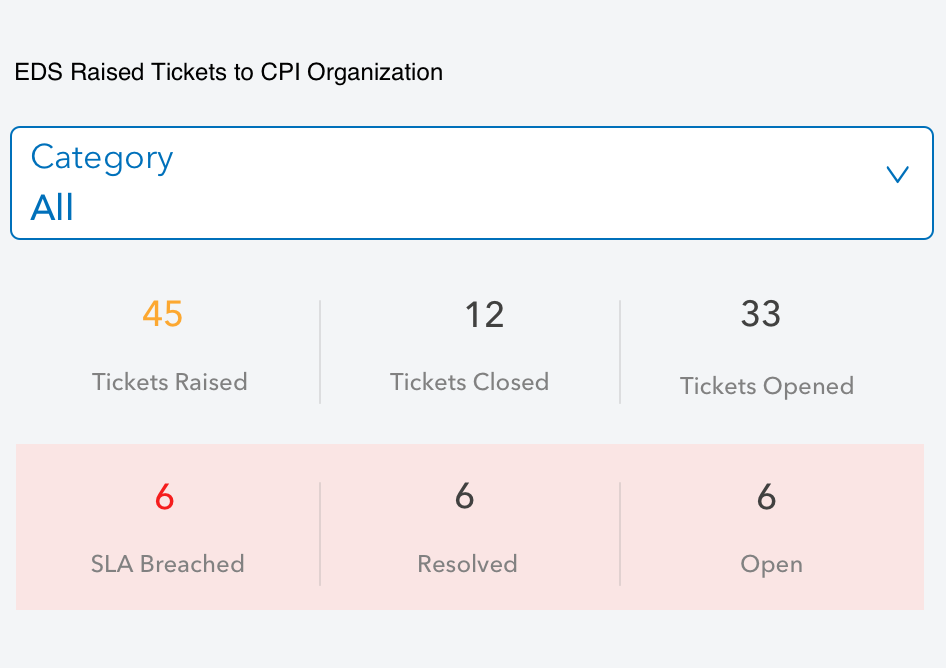
Simplify the visulaization
Simplifying as much as possible helps in better retention. Sometimes, numbers have a significant impact whenever temporal data representations are not necessary.
Here, I provide the emphasis for the data with color codes to the number to quantify the data.
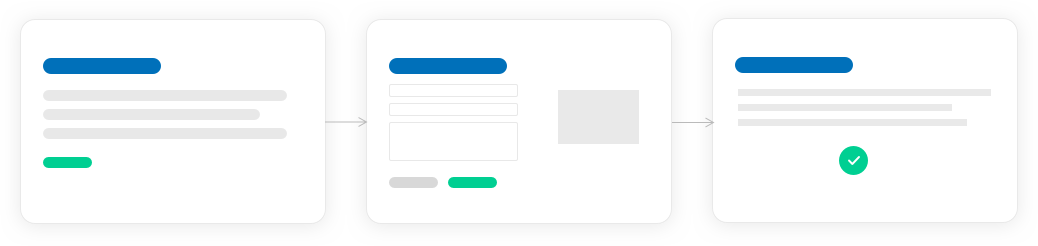
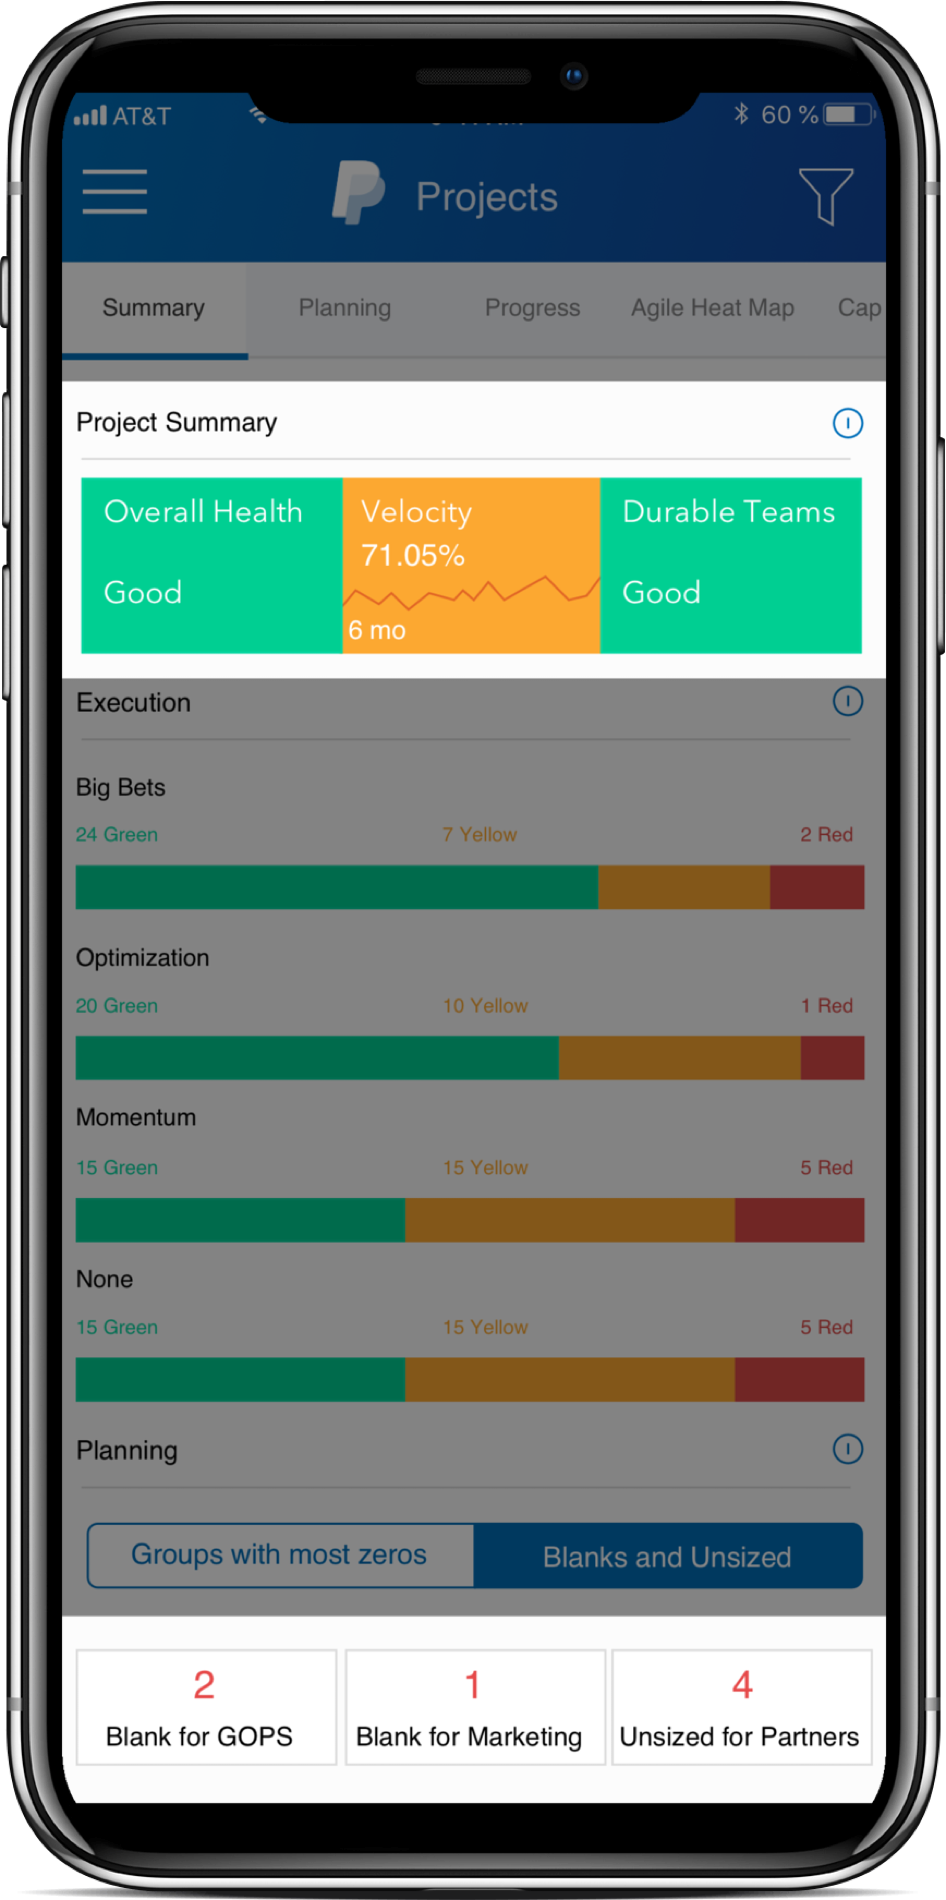
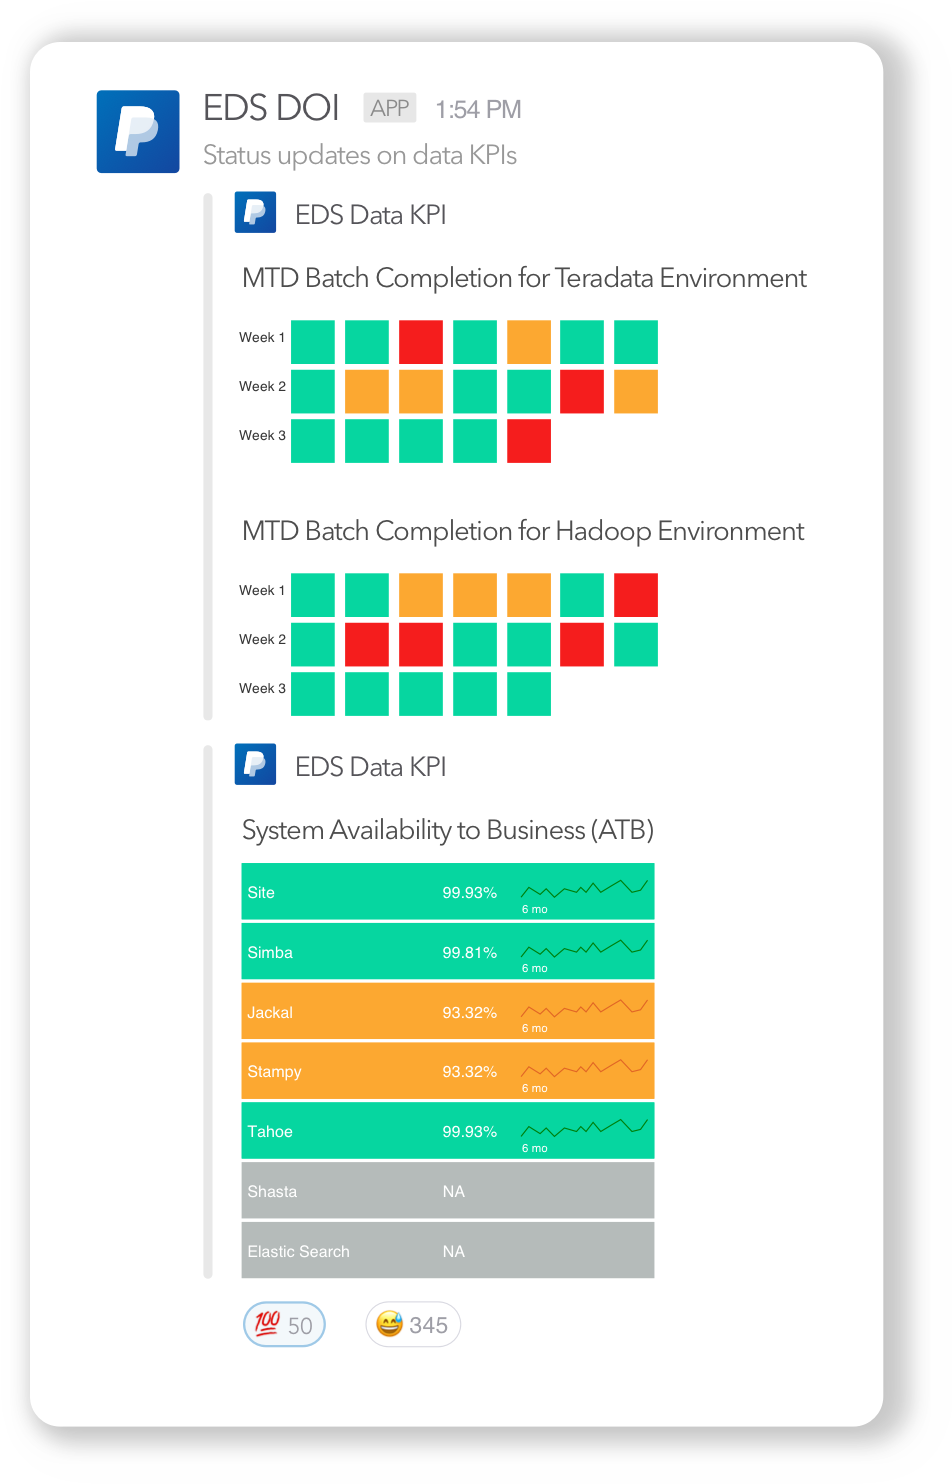
Provide Overview for quick consumption
1. A quick summary of the project provides a succinct idea of the status of the project.
2. Color coding the information helps users to effectively skim through complex visualizations.
3. Providing trend lines is a common good practice for giving an overview and context.
- A quick summary of the project provides a succinct idea of the status of the project.
- Color coding the information helps users to effectively skim through complex visualizations.
- Providing trend lines is a common good practice for giving an overview and context.
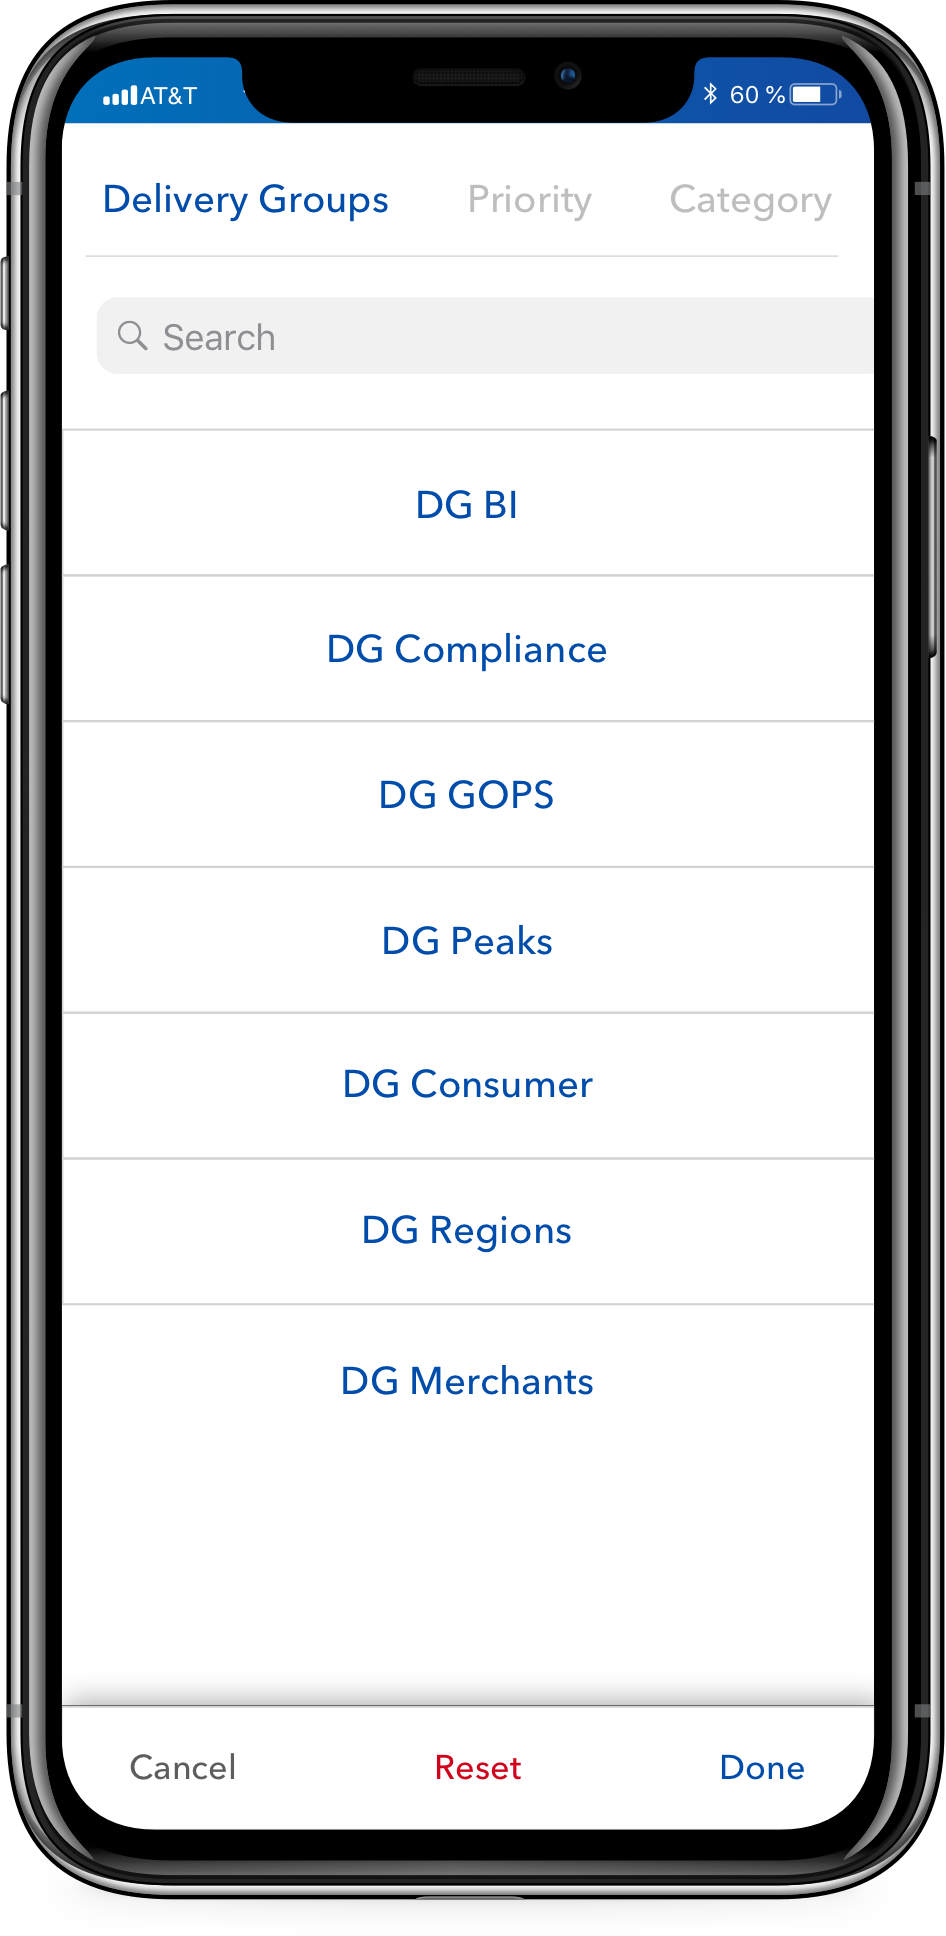
Provide control to filter, sort or zoom to reduce cognitive overlaod
From the user research, I understood that users are bombarded with data that is not useful to them. That includes data from other Delivery Groups. Having a filter to enable users to select DGs that are useful to them helps to reduce the cognitive mental load for the user.
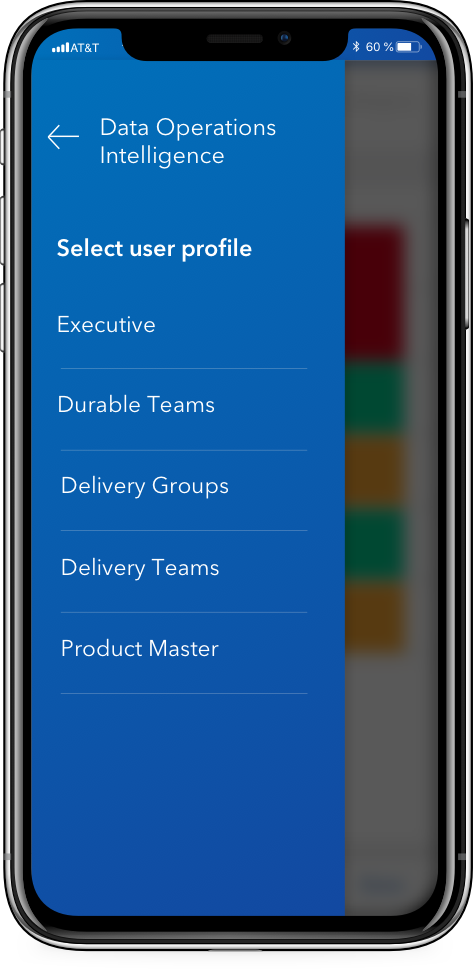
Provide control to filter, sort or zoom to reduce cognitive overlaod
Different users want to access different aspects of the same dataset. One way to better cater to this need is data abstraction. Data abstraction based on the role or profile.
For example, Durable teams often have access to data across various products. An executive wants to see the high-level trends of the organization’s health. A delivery group manager would like to see the data of all the teams in that delivery group unlike the Delivery team lead who wants to see just the data related to just that team.
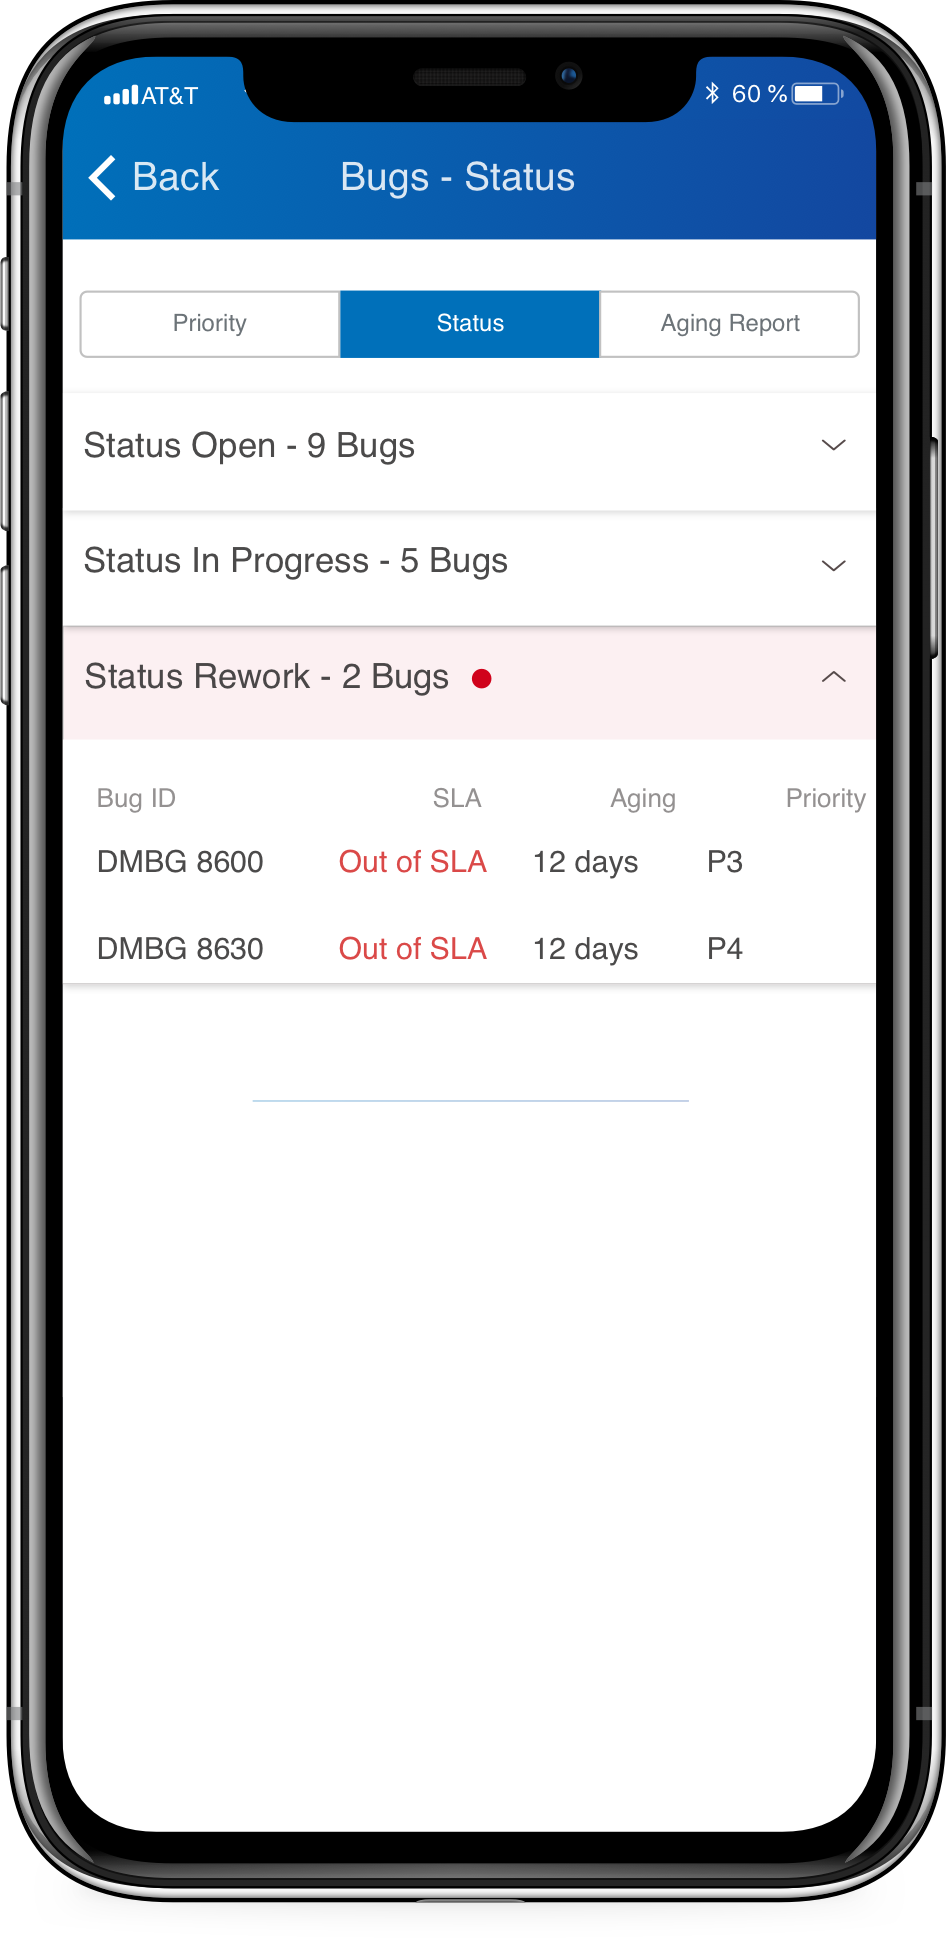
Let the user's view details on demand
Color coding certain regions are a great way to attract user’s attention. This is done only at places where it is absolutely necessary to draw the user’s attention.
After directing the user’s attention whenever needed, I gave the users a way-in to explore or investigate the details on demand.
How to increase employee productivity
The whole idea for a mobile application is to enhance employee productivity by providing seamless access to data. This opens up a wide range of opportunities to integrate EDS apps with other communication platforms like Slack.
When users use “third-party” apps to enhance better usability, then there is room for improvement
Design opportunity #1 - Slack App
During follow up feedback after the app went into production, one user behavior we noticed was that employees did not use the share option effectively. Employees often took screenshots of visualizations and share them on their Slack channel and start discussions every day.
This led to a design idea to build a Slack App that provides automated morning updates to the team’s slack channels which could be useful during daily huddles.
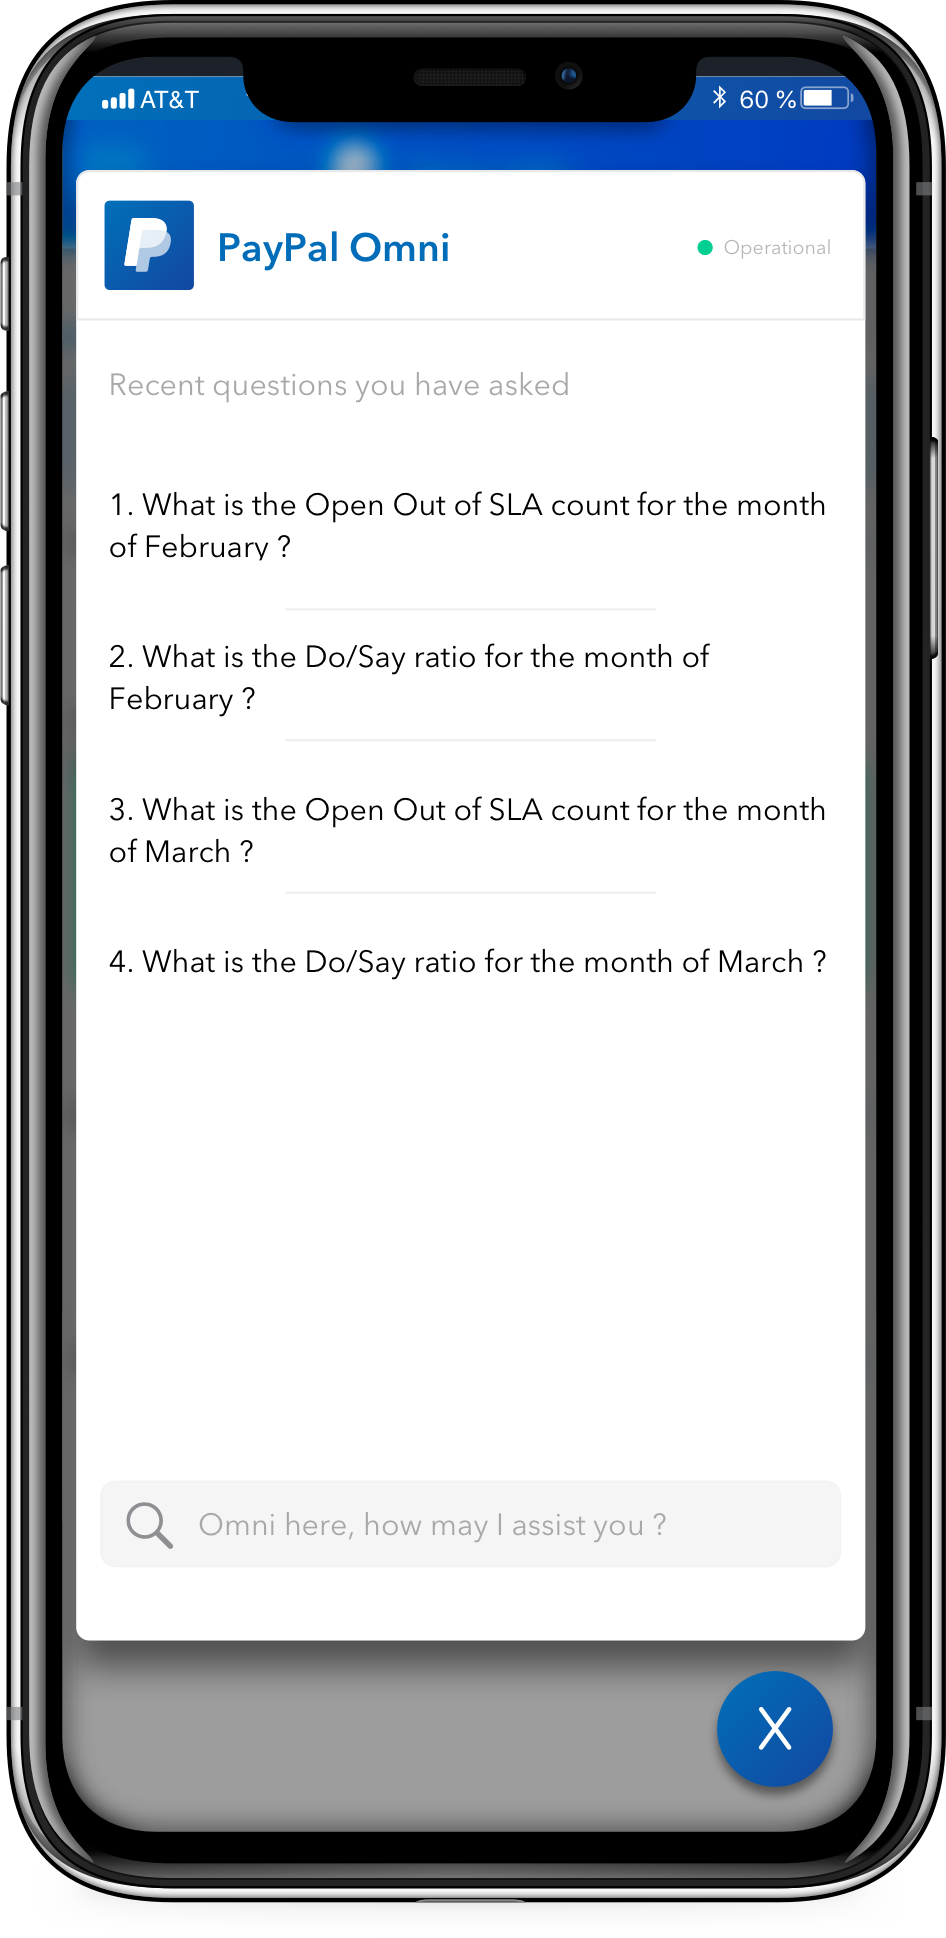
Design opportunity #2 - Recommended questions by a chatbot
After I consulted with the analytics team, I narrowed down the various frequently asked questions by the employees and proposed a conversational agent that follows a strict hierarchy. The recommendations are based on the recent and recurring questions searched by the employee.
User adoption and engagement increases over time
As a designer, it is my responsibility to work with the developers and collect post-production feedback in a tight feedback loop to iron out and include edge cases that were missed during the design and testing period. The 2 apps I shipped were downloaded by 1000+ unique users until I was at PayPal.
Experience and takeaways
Experience and takeaways
Experience and takeaways
I would say working at PayPal has been a fantastic experience for me. It was the most important and challenging project so far.
- I learned to grow professionally, keeping tabs on different projects simultaneously.
- It taught me how to walk through my designs to different audiences - Executives, managers, and developers.
- Push deliverables on time so that I don’t starve the dev team without user stories.
- Agile methodology in UX design.
- Visual design is a game-changer, especially in data visualization.
At grad school, I took Data Visualization as a part of my course work, and I learned about storytelling using data-centric dashboards.
Do you think I can thrive in your complex problem space? Let's talk!
Apart from work, I am fiddling around with Google Assistant actions to create a Bot that helps me be more productive. Ask me about that when we talk.
Email: hello@aravindjr.com
LinkedIn: Aravind Jembu Rajkumar
© Aravind 2021
Designer | Researcher | Product?