Brand
Summary
With personal digital assistants slowly gaining traction within households, we wanted to put Google assistant to test by performing a heuristic evaluation for Voice User Interfaces (VUIs)
Responsibilities
Summative heuristic analysis
Moderated usability testing
Duration
Jan 2019 - May 2019
VOICE ASSISTANTS
Voice assistants or virtual assistants use voice recognition and artificial intelligence to understand the verbal commands or questions of the user and provide appropriate answers or feedback. Google, Microsoft, Apple, and Amazon are the frontrunners in this field with millions of connected devices all around the world. MIT Technology Review has a compilation of 56 stories about how Voice Assistants can useful and sometimes be spooky.
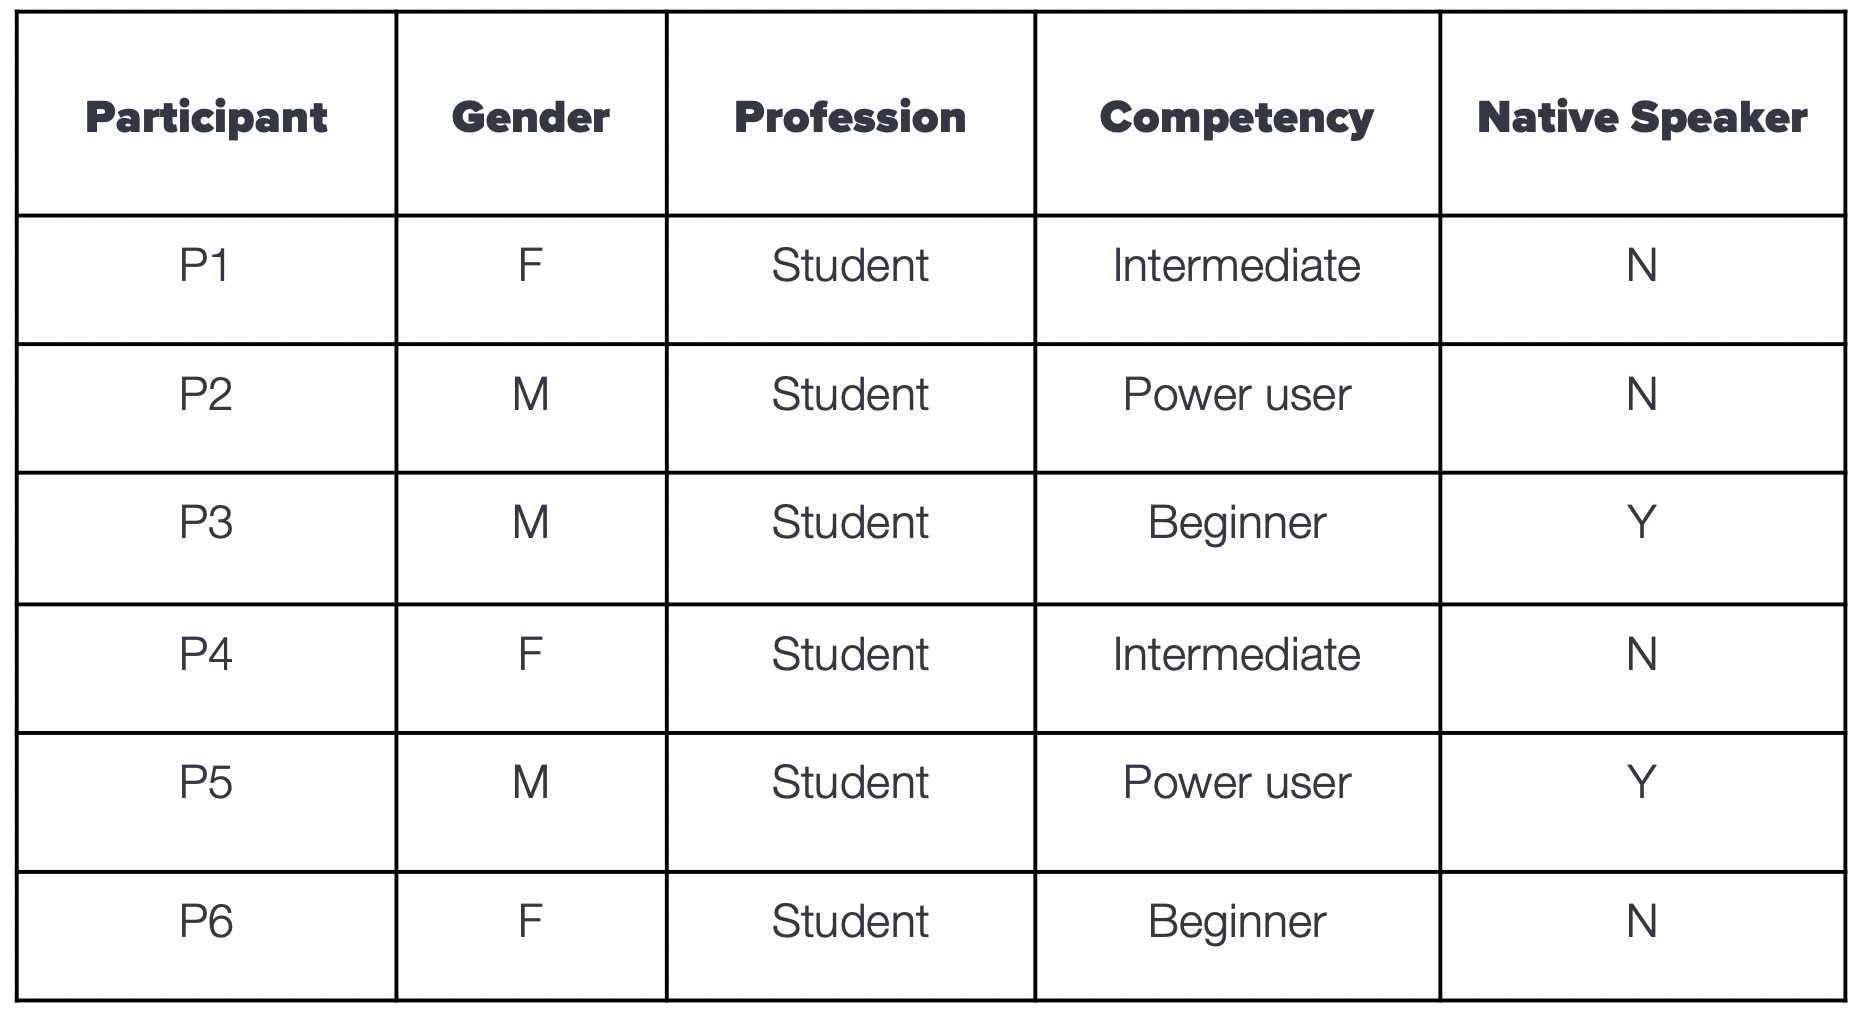
We screened 12 potential participants and selected 6 participants based on their digital literacy and competency with using any voice assistant. We had equal representation of gender and their proficiency to speak in English. The only shortcoming of this demographic is that all our participants were students between the age group 23 to 35.
We screened 12 potential participants and selected 6 participants based on their digital literacy and competency with using any voice assistant. We had equal representation of gender and their proficiency to speak in English. The only shortcoming of this demographic is that all our participants were students between the age group 23 to 35.
We screened 12 potential participants and selected 6 participants based on their digital literacy and competency with using any voice assistant. We had equal representation of gender and their proficiency to speak in English. The only shortcoming of this demographic is that all our participants were students between the age group 23 to 35.
ABOUT THE PROJECT
This project is part of my Advanced Usability Testing coursework. I was a part of a team of 3 User Researchers and designers. Our prompt was to test interesting products or software for its usability. We decided to test the usability of voice assistants for their screenless interfaces and because they were very subjective and widely understudied. Google Assistant in particular since it is the most available voice assistant at the time of this project.
The Prompt
The Problem statement for our semester-long project is to evaluate a design system that is being used widely on a day-to-day basis. The rubrics to evaluate the system are Consistency, efficiency and End-user satisfaction.
The Problem statement for our semester-long project is to evaluate a design system that is being used widely on a day-to-day basis. The rubrics to evaluate the system are Consistency, efficiency and End-user satisfaction.
The Problem statement for our semester-long project is to evaluate a design system that is being used widely on a day-to-day basis. The rubrics to evaluate the system are Consistency, efficiency and End-user satisfaction.
The Problem statement for our semester-long project is to evaluate a design system that is being used widely on a day-to-day basis. The rubrics to evaluate the system are Consistency, efficiency and End-user satisfaction.
The Goal
The goal of the study is to critique the usability of Google's Voice Assistant - The Google Assistant, which is widely available in over a billion smartphone devices. We realized that each user's needs and expectations of the assistant differ, hence we concentrated on end-user satisfaction.
The Problem statement for our semester-long project is to evaluate a design system that is being used widely on a day-to-day basis. The rubrics to evaluate the system are Consistency, efficiency and End-user satisfaction.
The Problem statement for our semester-long project is to evaluate a design system that is being used widely on a day-to-day basis. The rubrics to evaluate the system are Consistency, efficiency and End-user satisfaction.
The Problem statement for our semester-long project is to evaluate a design system that is being used widely on a day-to-day basis. The rubrics to evaluate the system are Consistency, efficiency and End-user satisfaction.
USABILITY RUBRICS
We believe in mixed methods because it sheds light on the underlying reasons and the general behavioral patterns. Quantitative data helps us to locate the problematic areas that set the focus to elicit qualitative data. In short, quantitative data helps us to answer the "what" and qualitative data helps us address the "why".
Qualitative data
Analyzed the verbal comments
Facial expressions
Reactions
- Analyzed the verbal comments
- Facial expressions
- Reactions
- Analyzed the verbal comments
- Facial expressions
- Reactions
- Analyzed the verbal comments
- Facial expressions
- Reactions
Quantitative data
Completion success rate
Time-taken to complete
Likert satisfaction scale
- Completion success rate
- Time-taken to complete
- Likert satisfaction scale
- Completion success rate
- Time-taken to complete
- Likert satisfaction scale
- Completion success rate
- Time-taken to complete
- Likert satisfaction scale
TASK LIST
We came up with a tasklist keeping in mind the various real-life use case scenarios.
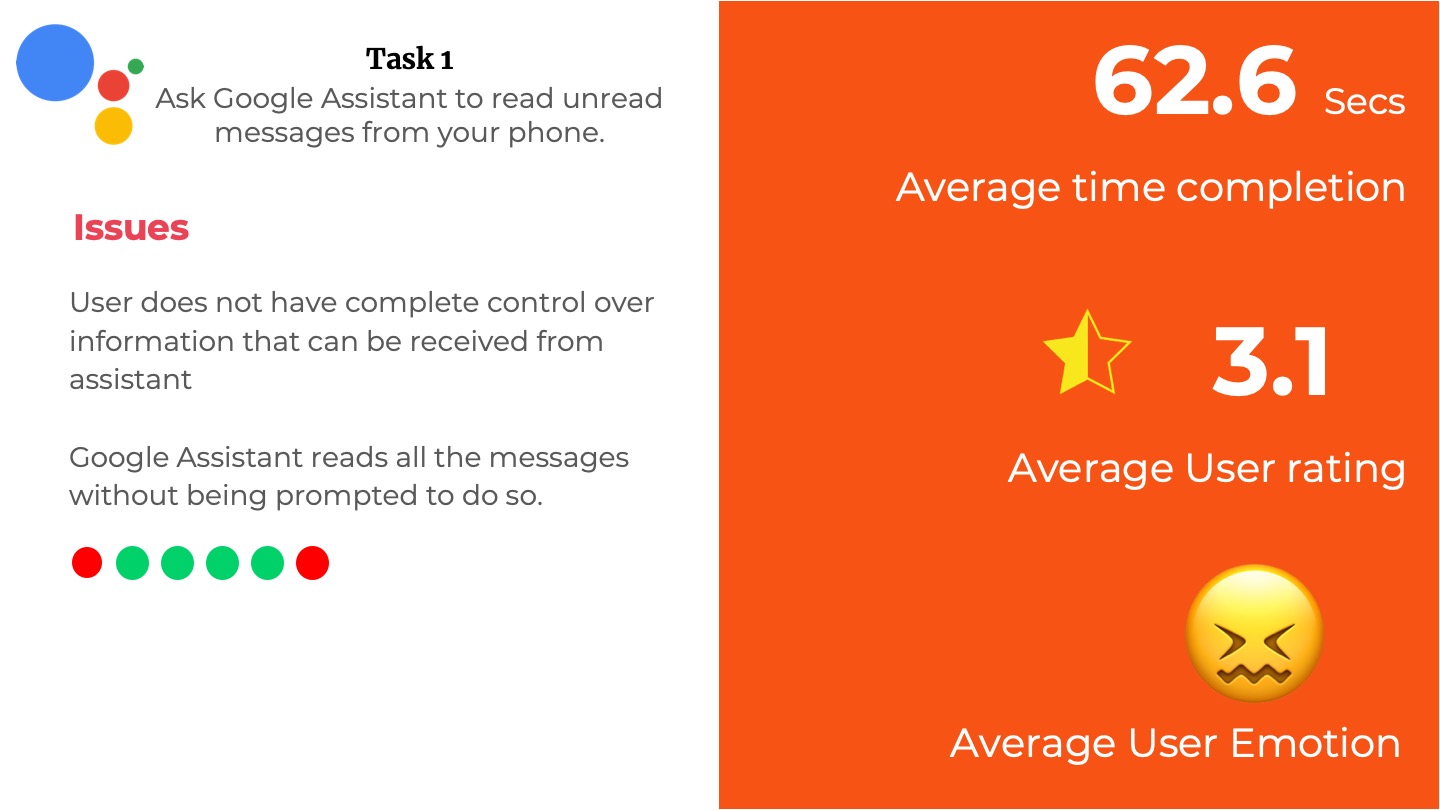
- Ask Google Assistant to read unread messages from your phone.
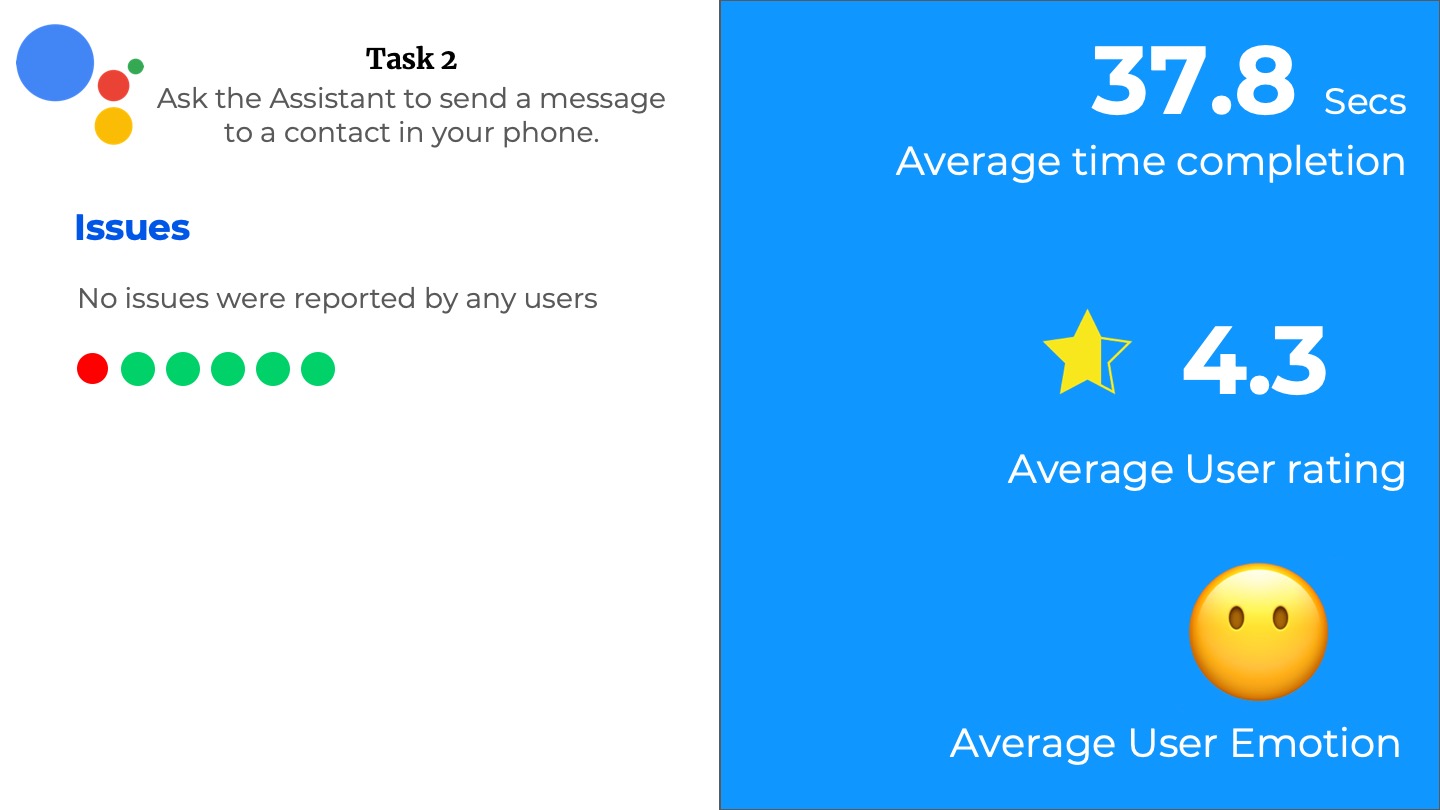
- Send a message to a contact in your phone.
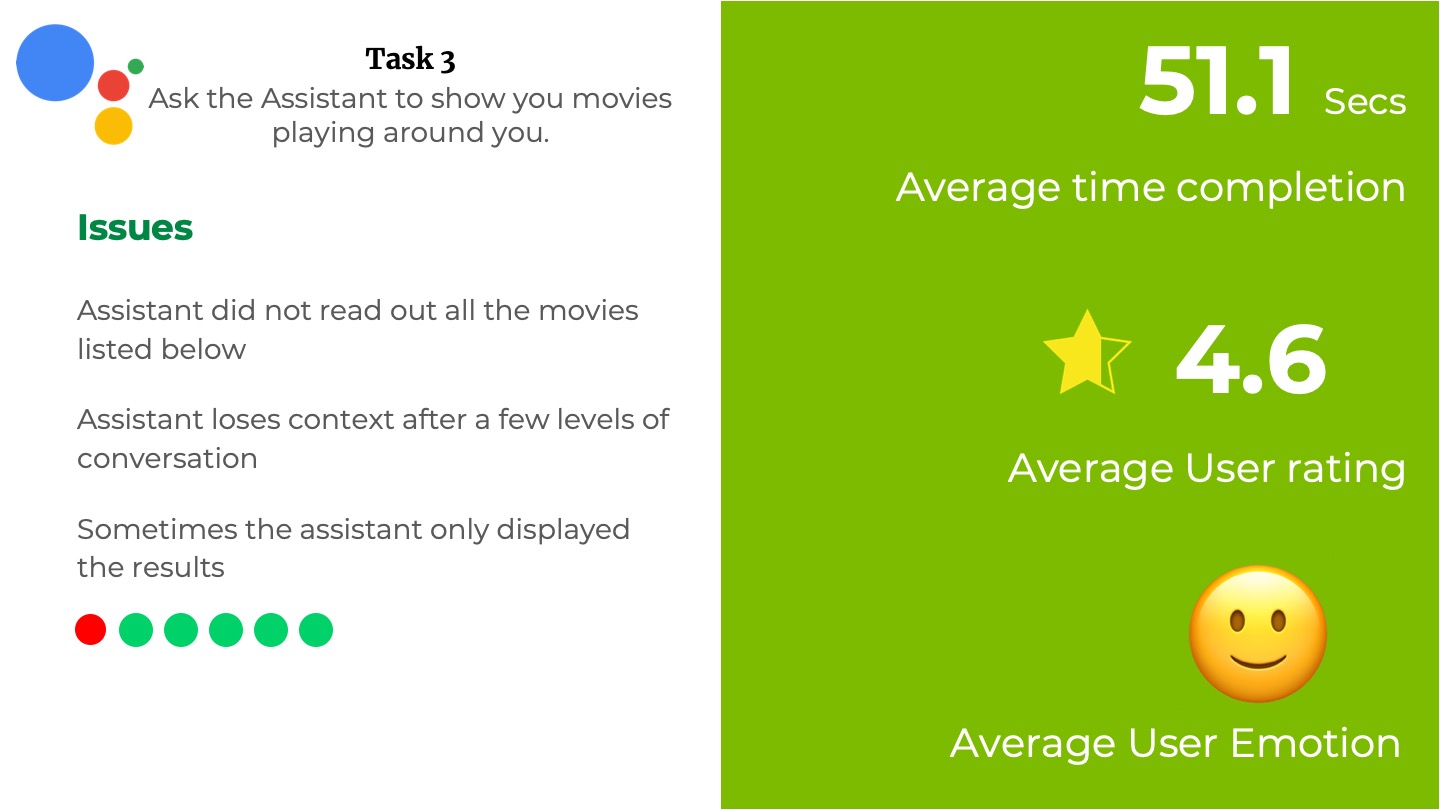
- Ask the Assistant to show you movies playing around you.
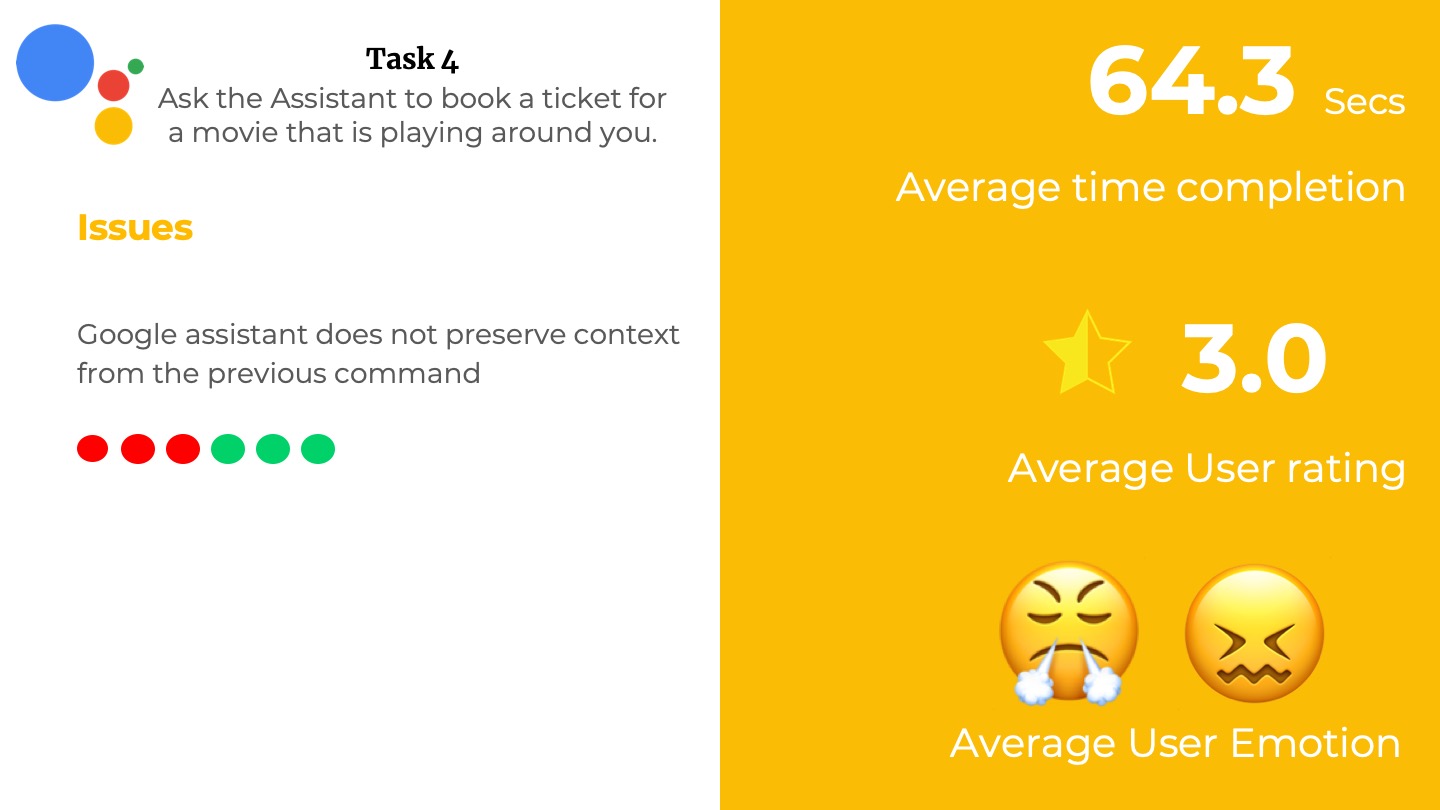
- Ask the Assistant to book a ticket for a movie that is playing around you.
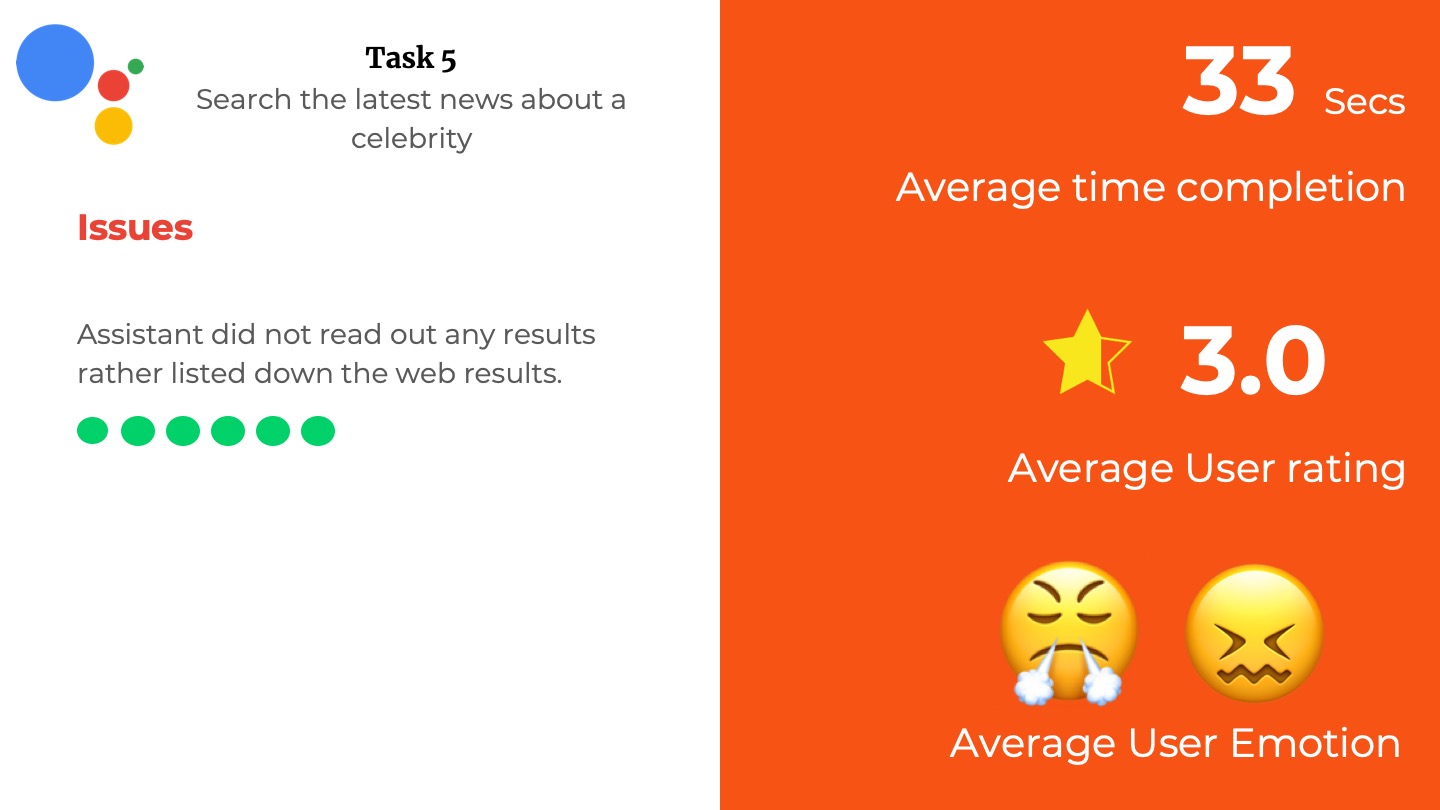
- Search the latest news about a celebrity.
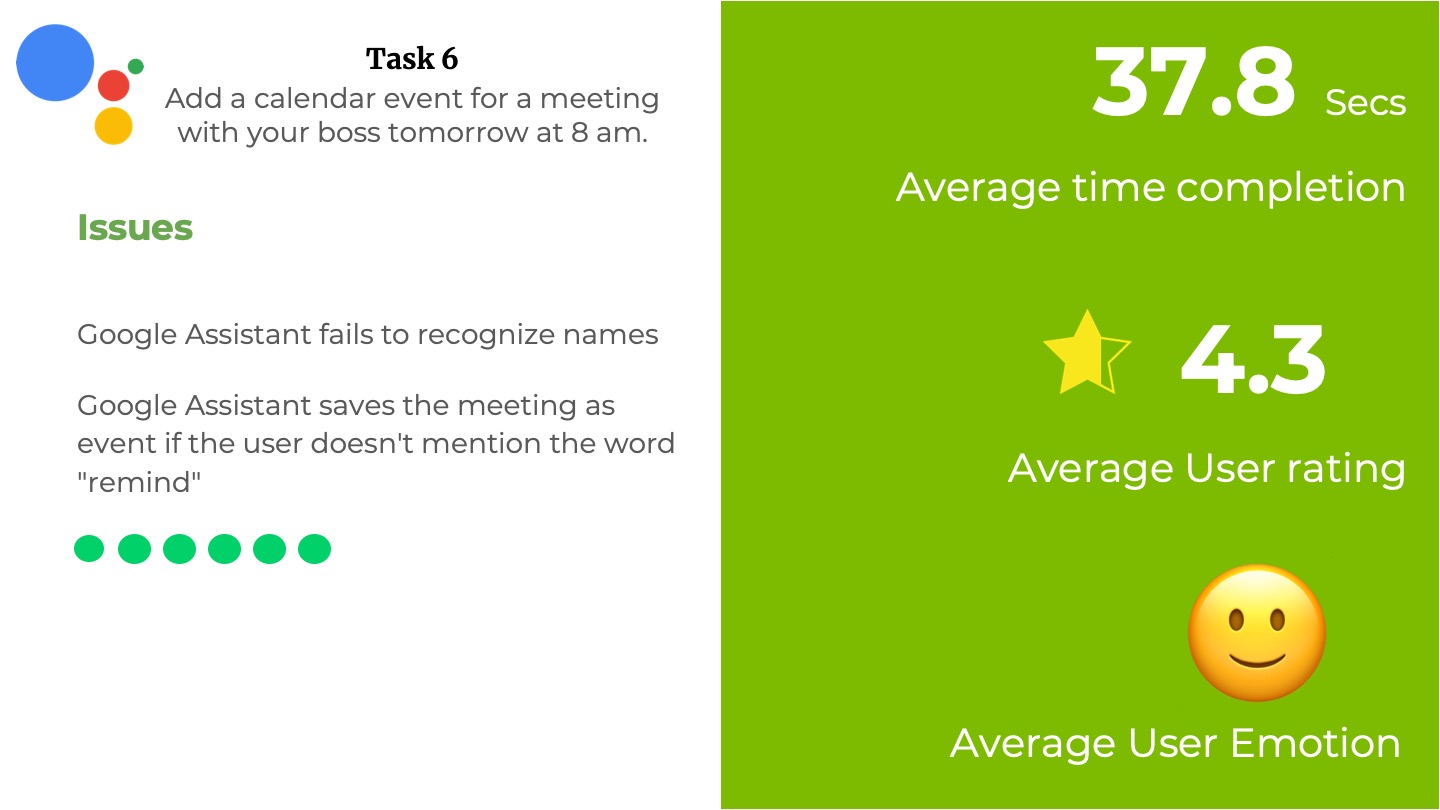
- Add a calendar event for a meeting with your boss tomorrow at 8 am.
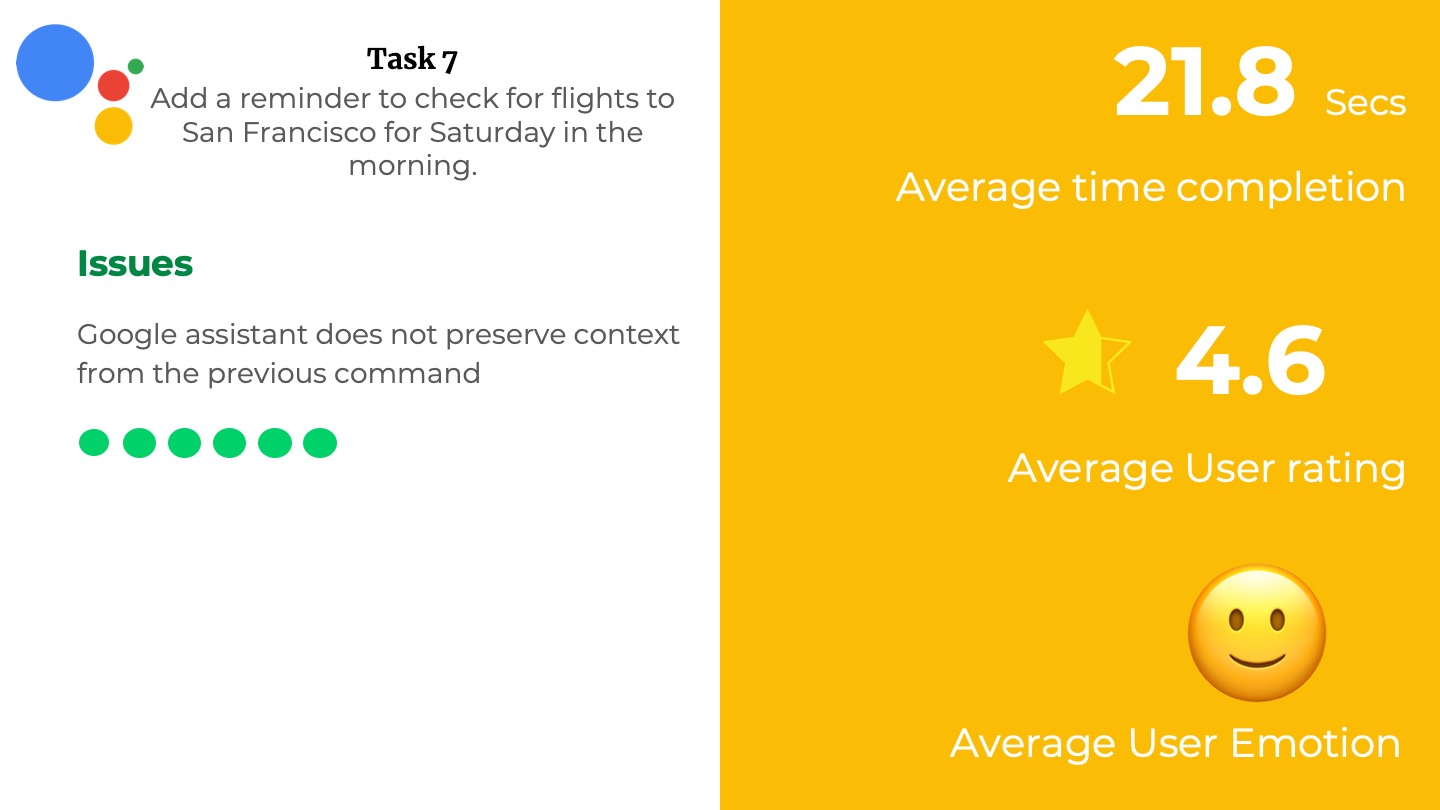
- Add a reminder to check for flights to San Francisco for Saturday in the morning.
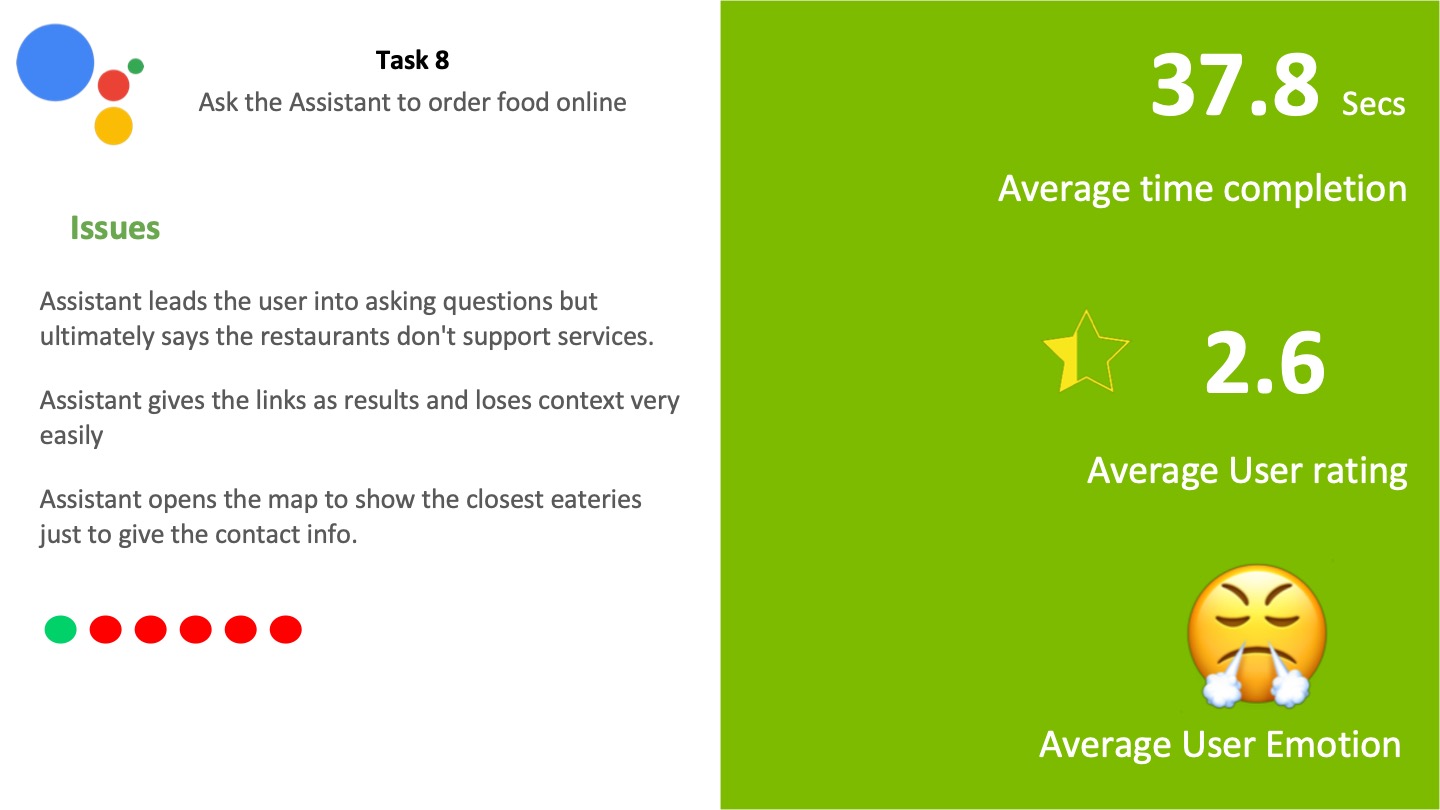
- Ask the Assistant to order food online.
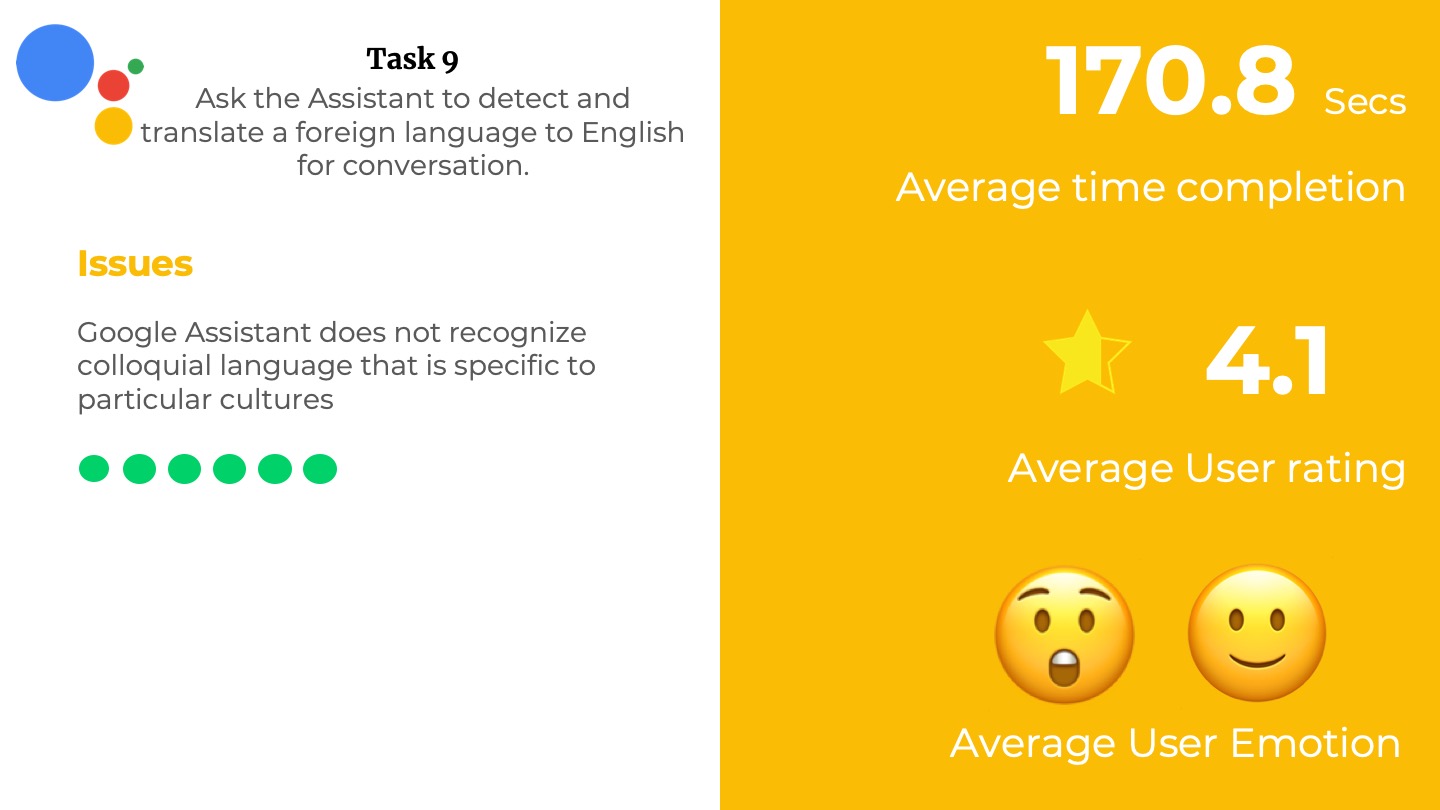
- Ask the Assistant to detect and translate a foreign language into English for conversation.
- Ask Google Assistant to read unread messages from your phone.
- Send a message to a contact in your phone.
- Ask the Assistant to show you movies playing around you.
- Ask the Assistant to book a ticket for a movie that is playing around you.
- Search the latest news about a celebrity.
- Add a calendar event for a meeting with your boss tomorrow at 8 am.
- Add a reminder to check for flights to San Francisco for Saturday in the morning.
- Ask the Assistant to order food online.
- Ask the Assistant to detect and translate a foreign language into English for conversation.
PILOT STUDIES
We conducted a pilot study on 2 pilot participants to evaluate and improve our study design for better usability experience for our participants and to get better data. The following changes were made to our study design after the pilot study.
- Simplified the tasks so that participants were able to comprehend the task.
- Optimized the study time from 45 minutes to 30 minutes.
- Make sure that the tasks were tailor-made to the scenarios in which they were grouped.
We conducted a pilot study with 2 participants to evaluate and improve our study design for better usability experience for our participants and to get better data. The following changes were made to our study design after the pilot study.
- Simplified the tasks so that participants were able to comprehend the task.
- Optimized the study time from 45 minutes to 30 minutes.
- Make sure that the tasks were tailor-made to the scenarios in which they were grouped.
We conducted a pilot study on 2 pilot participants to evaluate and improve our study design for better usability experience for our participants and to get better data. The following changes were made to our study design after the pilot study.
- Simplified the tasks so that participants were able to comprehend the task.
- Optimized the study time from 45 minutes to 30 minutes.
- Make sure that the tasks were tailor-made to the scenarios in which they were grouped.
USER DEMOGRAPHICS FOR THE STUDY
We screened 12 potential participants and selected 6 participants based on their digital literacy and competency with using any voice assistant. We had equal representation of gender and their proficiency to speak in English. The only shortcoming of this demographic is that all our participants were students between the age groups 23 to 35.
We screened 12 potential participants and selected 6 participants based on their digital literacy and competency with using any voice assistant. We had equal representation of gender and their proficiency to speak in English. The only shortcoming of this demographic is that all our participants were students between the age group 23 to 35.
We screened 12 potential participants and selected 6 participants based on their digital literacy and competency with using any voice assistant. We had equal representation of gender and their proficiency to speak in English. The only shortcoming of this demographic is that all our participants were students between the age group 23 to 35.
We screened 12 potential participants and selected 6 participants based on their digital literacy and competency with using any voice assistant. We had equal representation of gender and their proficiency to speak in English. The only shortcoming of this demographic is that all our participants were students between the age group 23 to 35.
TASK RESULTS
In the following carousal,
- The tasks performed by the user are listed.
- The various rubrics we used like Average Time-taken, Average user rating, and Average User Emotion.
- The various issues listed or observed by the users are also listed down.
- The dots represent the number of participants with the color indicating if it is successful or not.
TASK ANALYSIS
To get a better picture of how our users performed, I visualized the quantitative data using Tableau - a data visualization software. Below are the visualizations to help better understand the data we collected.
To get a better picture of how our users performed, I visualized the quantitative data using Tableau - a data visualization software. Below are the visualizations to help better understand the data we collected.
To get a better picture of how our users performed, I visualized the quantitative data using Tableau - a data visualization software. Below are the visualizations to help better understand the data we collected.
To get a better picture of how our users performed, I visualized the quantitative data using Tableau - a data visualization software. Below are the visualizations to help better understand the data we collected.
Time taken per task VS Competency
In most instances, beginners and intermediate users spent more time to perform the task.
Some of the power users spent more time in a certain task because their expectation was different from the assistant's response. So they tried framing the questions with different keywords.
The above visualization is an animated bar chart relating the time taken to complete the task vs the tasks. The user's time taken for that task are stacked on top of each other. It can be clearly seen that in most instances, beginners and intermediate users spent more time to perform the task.
Some of the power user spent more time in certain task because their expectation was different from the assistant's response. So they tried framing the questions with different keywords.
How users rated the Assistant's response
It was strange to see that irrespective of the user's competency, the rating (y-axis) was almost the same for the tasks (x-axis). This prompted the team to probe more into this interesting finding. The participants gave a unifying answer that they are okay if the voice assistant does not provide accurate answers since they had low expectations.
It was strange to see that irrespective of the user's compentancy, the rating (y-axis) was almost the same for the tasks (x-axis). This prompted the team to probe more into this interesting finding. The participants gave a unifying answer that they are okay if the voice assistant does not provide accurate answers and that they have low expectations.
It was strange to see that irrespective of the user's compentancy, the rating (y-axis) was almost the same for the tasks (x-axis). This prompted the team to probe more into this interesting finding. The participants gave a unifying answer that they are okay if the voice assistant does not provide accurate answers and that they have low expectations.
It was strange to see that irrespective of the user's compentancy, the rating (y-axis) was almost the same for the tasks (x-axis). This prompted the team to probe more into this interesting finding. The participants gave a unifying answer that they are okay if the voice assistant does not provide accurate answers and that they have low expectations.
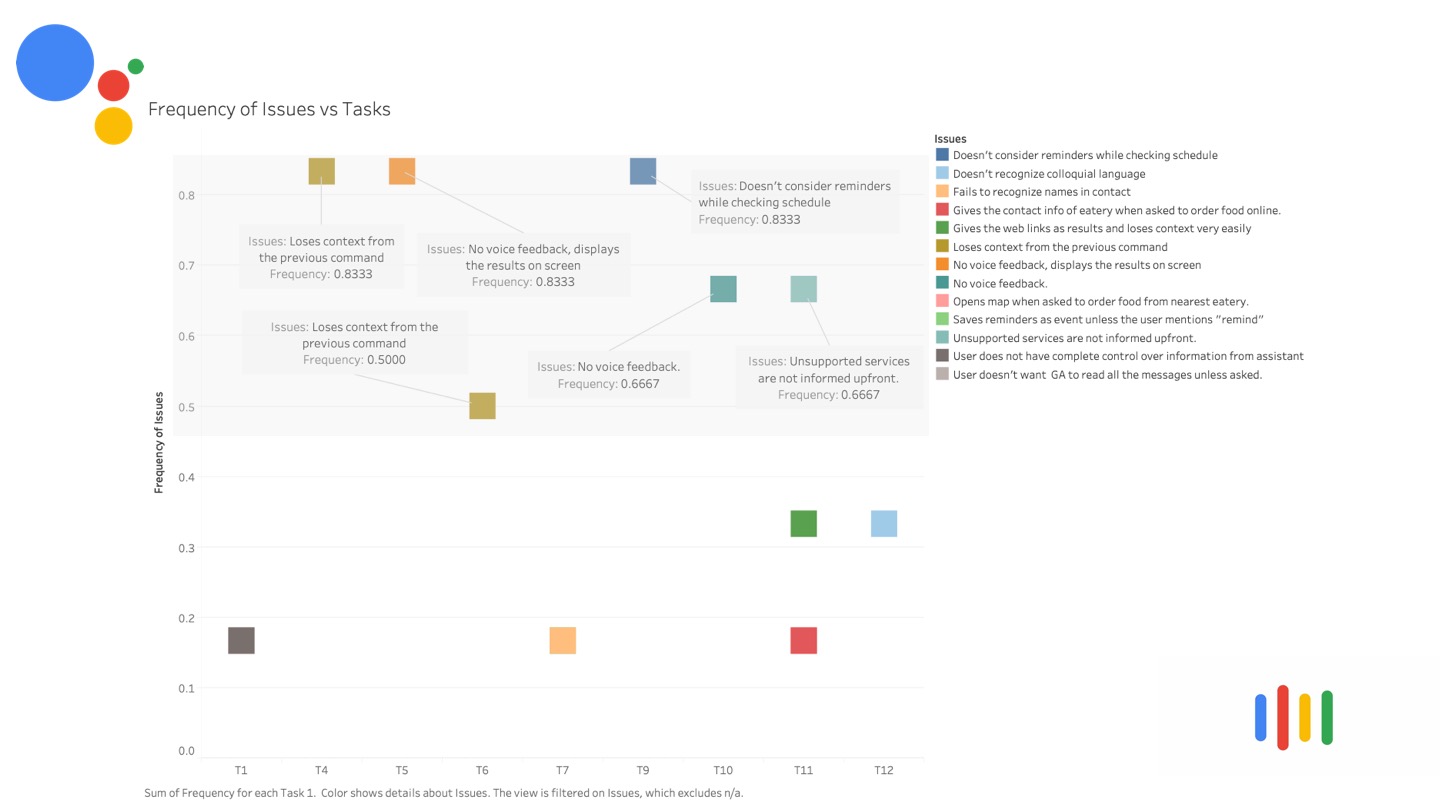
Frequency of Issues VS Tasks
We investigated the various issues our participants reported and found a reoccurring pattern both within the task and across tasks. This chart shows the Frequency of issues (y-axis) and the tasks (x-axis).
The highlighted section contains the issues that occur more than once per task or across tasks.
We investigated the various issues our participant reported and found a reoccuring pattern both within the task and across tasks. The above chart shows the Frequency of issues (y-axis) and the tasks (x-axis).
We investigated the various issues our participant reported and found a reoccuring pattern both within the task and across tasks. The above chart shows the Frequency of issues (y-axis) and the tasks (x-axis).
We investigated the various issues our participant reported and found a reoccuring pattern both within the task and across tasks. The above chart shows the Frequency of issues (y-axis) and the tasks (x-axis).
RECOMMENDATIONS
- Train the assistant on languages so that it can recognize the user’s pronunciation and colloquial language more accurately.
- Enhance the ability for continued conversation by incorporating more trigger words for a follow-up response. (Like yes, no, stop).
- Understand the context and react to the user’s request in a smart and informed way.
- Give the user the freedom to choose just voice interaction or visual interaction.
- Add a function that automatically provides some choices of what it thinks the user is trying to convey and let the user pick from those options if the users fail to ask the question more than 2-3 times.
- A clear distinction between “Events” and “Reminders”.
- Improve the food ordering mechanism.
- Train the assistant on languages so that it can recognize the user’s pronunciation and colloquial language more accurately.
- Enhance the ability for continued conversation by incorporating more trigger words for a follow up response. (Like yes, no, stop).
- Understand the context and react to the user’s request in a smart and informed way.
- Give the user freedom to choose just voice interaction or visual interaction.
- Add a function that automatically provides some choices of what it thinks the user is trying to convey and let the user pick from those options, if the users fails to ask the question more than 2-3 times.
- Clear distinction between “Events” and “Reminders”.
- Improve the food ordering mechanism.
MAJOR CONCERNS OF VUI
- Privacy and security concerns - “I don’t want Google to read my messages”
- Language support - “It doesn’t always get what I am saying”
- Discovery and retention - “I didn’t know that this feature exists. It's cool”
1.Privacy and security concerns - “I don’t want Google to read my messages”
2.Language support - “It doesn’t always get what I am saying”
3.Discovery and retention - “I didn’t know that this feature exists. Its cool ”
1.Privacy and security concerns - “I don’t want Google to read my messages”
2.Language support - “It doesn’t always get what I am saying”
3.Discovery and retention - “I didn’t know that this feature exists. Its cool ”
1.Privacy and security concerns - “I don’t want Google to read my messages”
2.Language support - “It doesn’t always get what I am saying"
3.Discovery and retention - “I didn’t know that this feature exists. Its cool ”
LIMITATIONS
- The test was conducted on a small set of users.
- Google Assistant faced trouble to recognize voice profiles for different people and tailor the responses accordingly as they were not using their own device for the study.
- The users were biased while rating each task based on the feature they discovered.
- The test was conducted on a small set of users.
- Google Assistant faced trouble to recognise voice profiles for different people, and tailor the responses accordingly as they were not using their own device for the study
- The users were biased while rating each task based on the feature they discovered
CONCLUSION
For the widespread implementation of VUI, machines should enhance the user experience by,
- Comprehending context.
- Understanding the user’s tone, attitude, and intention.
- Personalize the user experience based on historical data and the observation of previous patterns of behavior.
For widespread implementation of VUI, machines should enhance the user experience by
- Comprehending context
- Understanding the user’s tone, attitude, and intention
- Personalize the user experience based on historical data and the observation of previous patterns of behaviour
For widespread implementation of VUI, machines should enhance the user experience by
- Comprehending context
- Understanding the user’s tone, attitude, and intention
- Personalize the user experience based on historical data and the observation of previous patterns of behaviour
For widespread implementation of VUI, machines should enhance the user experience by
- Comprehending context
- Understanding the user’s tone, attitude, and intention
- Personalize the user experience based on historical data and the observation of previous patterns of behaviour
Do you think I can thrive in your complex problem space? Let's talk!
Apart from work, I am fiddling around with Google Assistant actions to create a Bot that helps me be more productive. Ask me about that when we talk.
Email: hello@aravindjr.com
LinkedIn: Aravind Jembu Rajkumar
© Aravind 2021
Designer | Researcher | Product?